Alabama Math 2.DA.A.16
Standard Cluster
- 2.DA.A
- Collect and analyze data and interpret results.
Create a picture graph and bar graph to represent data with up to four categories. a. Using information presented in a bar graph, solve simple “put-together,” “take-apart,” and “compare” problems. b. Using Venn diagrams, pictographs, and "yes-no" charts, analyze data to predict an outcome.
2019 Alabama Course of Study: Mathematics · Data Analysis
Cluster contents
Standards in This Cluster
2.DA.A.16 is a cluster heading. These are the individual standards under it.
Teacher's field guide
What This Cluster Means
What Students Need to Do
- Students sort data into up to four groups and draw picture graphs and bar graphs. They use bar graphs to find totals, missing parts, and differences. They read Venn diagrams, picture graphs, and yes-no charts to make predictions.
What Mastery Looks Like
- Given a class tally, a student labels both graphs and shows the correct count for each group. They can explain that 8 votes for apples and 5 for pears means 3 more votes for apples. They use the counts in a chart to support a prediction.
Common Misconceptions
- Students may draw bars that do not match the counts or forget to check what each picture represents. They may add two bars when asked how many more, or count the overlap in a Venn diagram as an unrelated group.
How to Assess It
- Give students a tally: apples 6, bananas 4, oranges 3, pears 2. Ask them to draw both graphs, find how many more chose apples than pears, and predict the next student's choice.
Lesson moves
Ways to Teach It
Give pairs 12 counters in four colors; have them sort, tally, and draw a picture graph and a bar graph.
Show bars for 7 bus riders and 4 walkers; ask, 'How many in all? How many more ride the bus?'
Deal cat, dog, both, and neither cards; partners fill a Venn diagram and a 'has a cat?' yes-no chart, then predict the next card.
Use yesterday's cafeteria lunch tally to make a picture graph, then predict which meal the cafeteria should prepare more of tomorrow.
Free download
Printable 2.DA.A.16 Worksheet
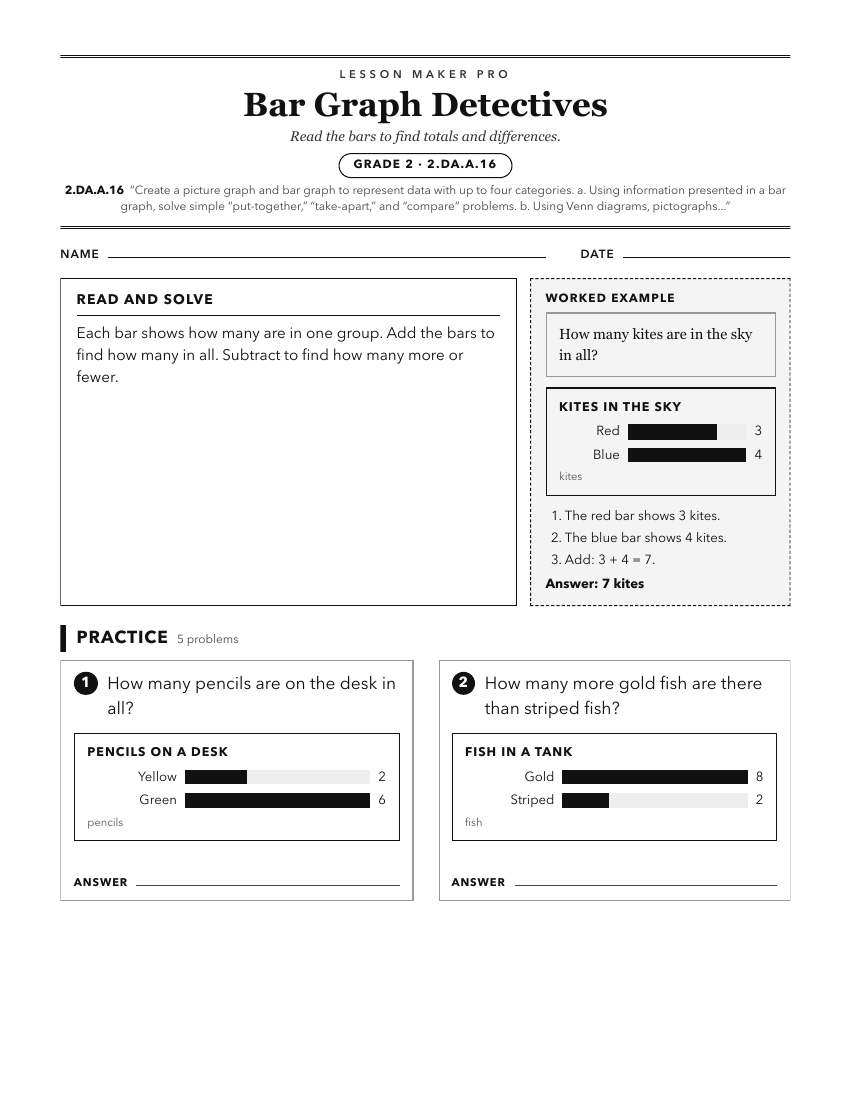
A ready-to-print activity worksheet aligned to 2.DA.A.16, with an answer key for the teacher on its own page. No account needed.
PDF, US Letter, prints cleanly in black and white.
Download the worksheetKeep exploring
Related Standards
- 3.DA.A.16
For a given or collected set of data, create a scaled (one-to-many) picture graph and scaled bar graph to represent a data set with several categories.
- 1.DA.A.16
Organize, represent, and interpret data with up to three categories.
- 8A.DSP.C.39.a
Summarize categorical data for two categories in two-way frequency tables and represent using segmented bar graphs.
- A1P.DSP.D.35.a
Summarize categorical data for two categories in two-way frequency tables and represent using segmented bar graphs.
Turn this cluster into a lesson
Grade, subject, topic, and the complete cluster are prefilled. Create one free, no account needed.
Also for this cluster:Make a WorksheetMake a QuizMake a Sub Lesson