Alabama Math 2.DA.A.16.a
The Standard
- 2.DA.A
- Collect and analyze data and interpret results.
- 2.DA.A.16
- Create a picture graph and bar graph to represent data with up to four categories.
Using information presented in a bar graph, solve simple “put-together,” “take-apart,” and “compare” problems.
2019 Alabama Course of Study: Mathematics
Teacher's field guide
What This Standard Means
What Students Need to Do
- Students read a bar graph to find the count for each group. They use those counts to find a total, a missing part, or how many more or fewer.
What Mastery Looks Like
- A student can use a graph of snack votes to find the total for two snacks and the difference between them. They can use a given total and one bar to find a missing count, then write an equation for each answer.
Common Misconceptions
- Students may match a bar to the wrong label or count grid lines instead of units. They may add the bars when asked how many more, or give the taller bar's count instead of the difference.
How to Assess It
- Give students a bar graph showing 6 apple votes, 4 banana votes, and 3 orange votes. Ask: “How many apple and banana votes altogether? How many more apples than oranges? Of 10 apple and banana votes, how many are for bananas?” Have them write an equation for each answer.
Lesson moves
Ways to Teach It
Have pairs build bars with 6 cat, 4 dog, and 3 fish cubes, then combine or separate cubes to answer vote questions.
Show bars for 7 bike riders and 5 walkers; ask, “Why does adding the bars not tell us how many more rode bikes?”
Play Graph Detective with bars for 8 red, 5 blue, and 2 green marbles; partners trade total, missing-part, and comparison questions.
Graph today's lunch choices on the board, then ask students to find the total for two meals and the difference between them.
Free download
Printable 2.DA.A.16.a Worksheet
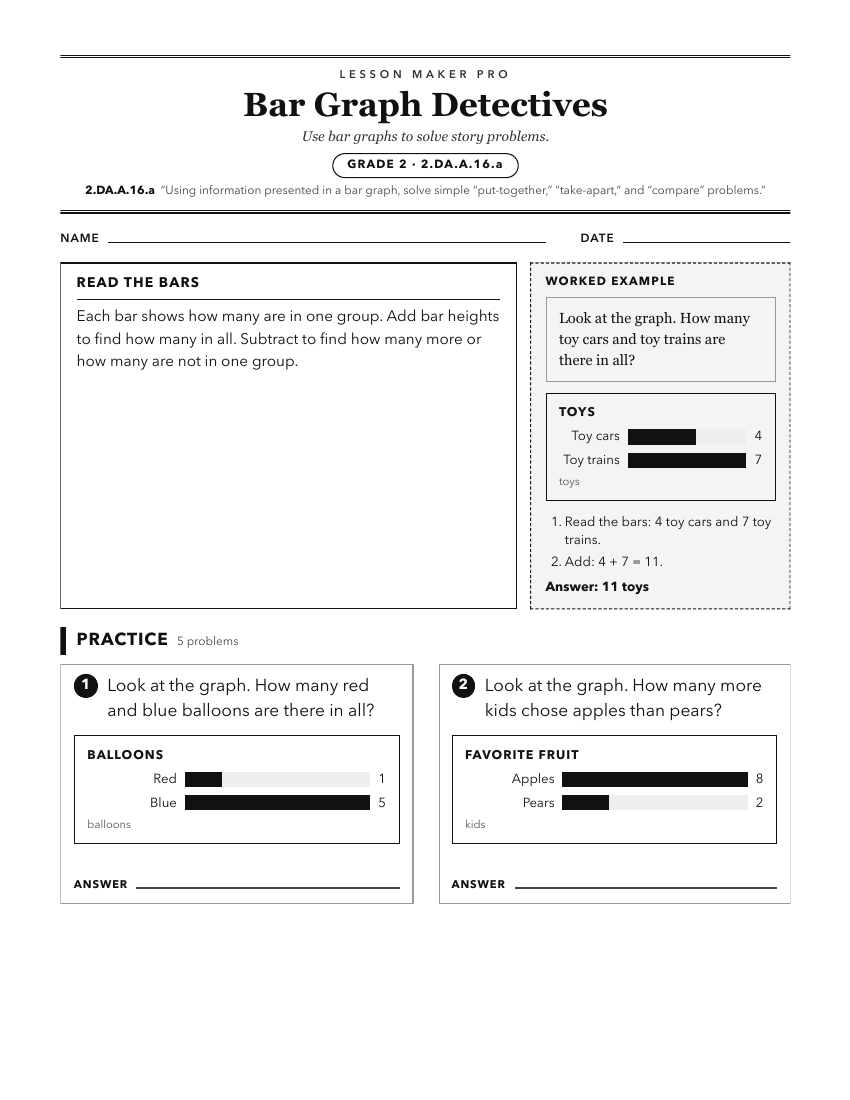
A ready-to-print activity worksheet aligned to 2.DA.A.16.a, with an answer key for the teacher on its own page. No account needed.
PDF, US Letter, prints cleanly in black and white.
Download the worksheetKeep exploring
Related Standards
- 3.DA.A.16.b
Solve one- and two-step "how many more" and "how many less" problems using information presented in scaled graphs.
- 4.DA.A.20
Interpret data in graphs (picture, bar, and line plots) to solve problems using numbers and operations.
- 4.DA.A.20.b
Solve problems involving addition and subtraction of fractions using information presented in line plots.
- 5.DA.A.16.a
Add, subtract, multiply, and divide fractions to solve problems involving information presented in line plots.
Turn this exact standard into a lesson
Grade, subject, topic, and the complete standard are prefilled. Create one free, no account needed.
Also for this standard:Make a WorksheetMake a QuizMake a Sub Lesson