Alabama Math 2.DA.A.16.b
The Standard
- 2.DA.A
- Collect and analyze data and interpret results.
- 2.DA.A.16
- Create a picture graph and bar graph to represent data with up to four categories.
Using Venn diagrams, pictographs, and "yes-no" charts, analyze data to predict an outcome.
2019 Alabama Course of Study: Mathematics
Teacher's field guide
What This Standard Means
What Students Need to Do
- Students read data in Venn diagrams, pictographs, and yes-no charts. They compare counts and use what they find to predict a likely next answer.
What Mastery Looks Like
- A student counts each group correctly, including the overlap in a Venn diagram. They make a prediction and point to the counts that support it.
Common Misconceptions
- Students may count the Venn overlap twice when finding the total. They may miss the pictograph key or treat a no vote as missing data. They may think the most common answer is guaranteed to come next.
How to Assess It
- Show a yes-no chart with 8 yes votes and 3 no votes for 'Do you like apples?' Ask, 'What will the next student probably say? Which counts support your prediction?'
Lesson moves
Ways to Teach It
Have students place sticky notes in a floor Venn diagram for 'likes apples' and 'likes bananas,' then predict where the next note will go.
Show a pictograph with 6 walkers and 3 bus riders, one picture per child. Ask, 'How might the next child travel? Why?'
Give pairs hidden vote cards for 'Do you like carrots?' Have them update a yes-no chart and predict each answer before revealing it.
Count red and blue pencils in a classroom cup, make a pictograph, then predict the color of a pencil pulled without looking.
Free download
Printable 2.DA.A.16.b Worksheet
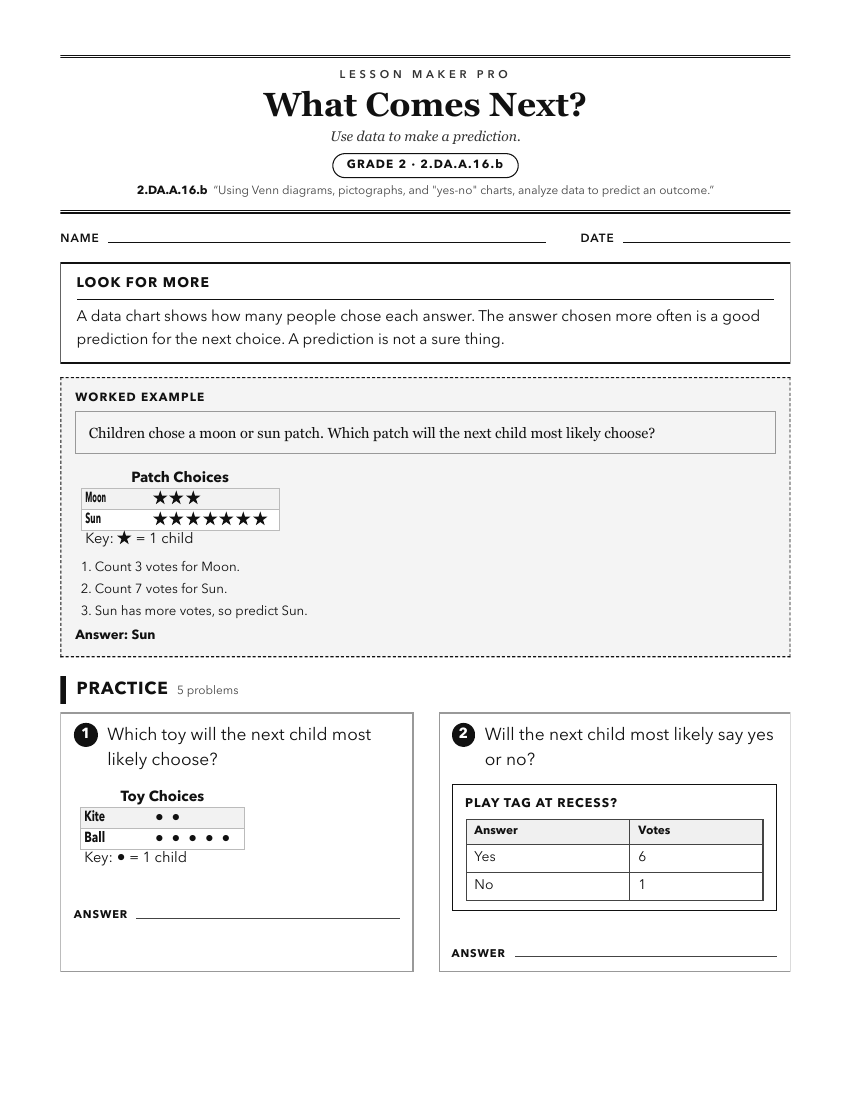
A ready-to-print activity worksheet aligned to 2.DA.A.16.b, with an answer key for the teacher on its own page. No account needed.
PDF, US Letter, prints cleanly in black and white.
Download the worksheetKeep exploring
Related Standards
- 1.DA.A.16.b
Summarize data on Venn diagrams, pictographs, and "yes-no" charts using real objects, symbolic representations, or pictorial representations.
- K.DA.A.15.a
Categorize data on Venn diagrams, pictographs, and "yes-no" charts using real objects, symbolic representations, or pictorial representations.
- 4.DA.A.20
Interpret data in graphs (picture, bar, and line plots) to solve problems using numbers and operations.
- 6.AF.C.21.a
Use tables, graphs, and equations to represent the relationship between independent and dependent variables.
Turn this exact standard into a lesson
Grade, subject, topic, and the complete standard are prefilled. Create one free, no account needed.
Also for this standard:Make a WorksheetMake a QuizMake a Sub Lesson