Texas TEKS 8.29.G
The Standard
- 8.29
- Social studies skills. The student applies critical-thinking skills to organize and use information acquired through established research methodologies from a variety of valid sources, including technology. The student is expected to:
create a visual representation of historical information such as thematic maps, graphs, and charts representing various aspects of the United States
Texas Essential Knowledge and Skills for Social Studies
Teacher's field guide
What This Standard Means
What Students Need to Do
- Students turn historical facts and data into a thematic map, graph, or chart. They choose a format that makes patterns, comparisons, or change over time clear.
What Mastery Looks Like
- Students select an effective visual format, organize information accurately, and label it clearly. They include a title, labels, scale or legend when needed, and reliable data.
Common Misconceptions
- Students may choose a graph type that does not fit the data or treat a thematic map like a location map. They may omit labels, distort scale, or add details unsupported by evidence.
How to Assess It
- Give students population data for four U.S. regions in 1850 and 1900. Ask them to create and label one visual showing change over time.
Lesson moves
Ways to Teach It
Give groups state population data, graph paper, and colored pencils to create a thematic map with a title and legend.
Ask students to write which visual best shows immigration change over time, then defend their choice with two reasons.
Run a visual match game where students pair historical data sets with the most useful map, bar graph, line graph, or pie chart.
Use local census data to create a chart comparing community population, jobs, or languages across two decades.
Free download
Printable 8.29.G Worksheet
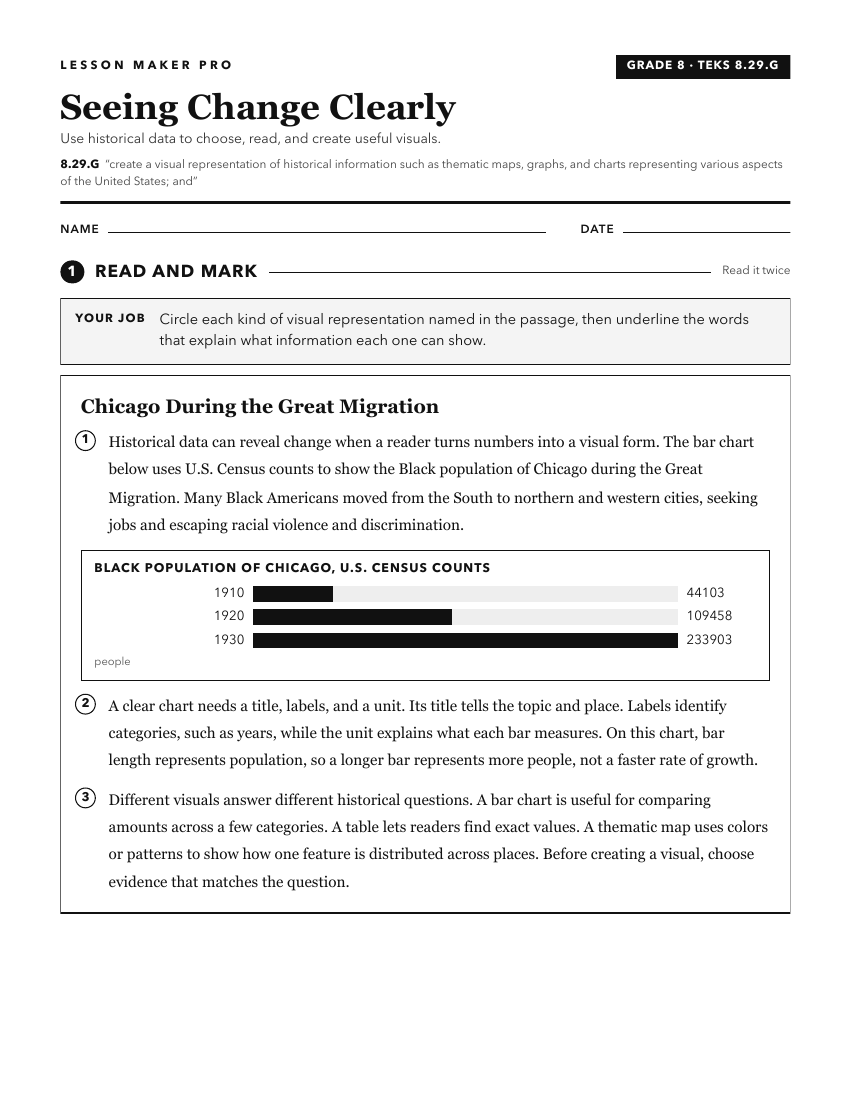
A ready-to-print activity worksheet aligned to 8.29.G, with an answer key for the teacher on its own page. No account needed.
PDF, US Letter, prints cleanly in black and white.
Download the worksheetKeep exploring
Related Standards
- 3.14.D
interpret and create visuals, including graphs, charts, tables, timelines, illustrations, and maps
- 7.21.A
create and interpret thematic maps, graphs, and charts representing various aspects of Texas during the 19th, 20th, and 21st centuries
- K.14.D
create and interpret visuals, including pictures and maps
- 4.19.D
organize and interpret information in outlines, reports, databases, and visuals, including graphs, charts, timelines, and maps
Turn this exact standard into a lesson
Grade, subject, topic, and the complete standard are prefilled. Create one free, no account needed.
Also for this standard:Make a WorksheetMake a QuizMake a Sub Lesson