Texas TEKS 7.21.A
The Standard
- 7.21
- Social studies skills. The student uses geographic tools to collect, analyze, and interpret data. The student is expected to:
create and interpret thematic maps, graphs, and charts representing various aspects of Texas during the 19th, 20th, and 21st centuries
Texas Essential Knowledge and Skills for Social Studies
Teacher's field guide
What This Standard Means
What Students Need to Do
- Students turn Texas data from the 1800s, 1900s, and 2000s into thematic maps, graphs, and charts. They read titles, legends, scales, labels, and patterns to make evidence-based comparisons.
What Mastery Looks Like
- A student selects a suitable display, plots data accurately, includes clear labels and a source, and explains what the display shows. The student compares periods and supports a conclusion with specific visual evidence.
Common Misconceptions
- Students may treat a thematic map like a general reference map or assume darker shading always means larger totals. They may mix percentages with raw counts, use uneven graph intervals, or claim causation from a visible trend.
How to Assess It
- Give students Texas urban population data for 1850, 1950, and 2020. Ask them to create one labeled graph and write two evidence-based observations comparing the periods.
Lesson moves
Ways to Teach It
Give pairs county data and blank Texas maps, then have them choose intervals, shade a choropleth map, and build a legend.
Display two Texas population graphs and ask, “Which claim is best supported, and what exact values prove it?”
Run a data display sort where teams match Texas data sets with the best map, graph, or chart and justify each match.
Use current drought monitor data to map affected Texas regions, then compare the pattern with a historical drought map.
Free download
Printable 7.21.A Worksheet
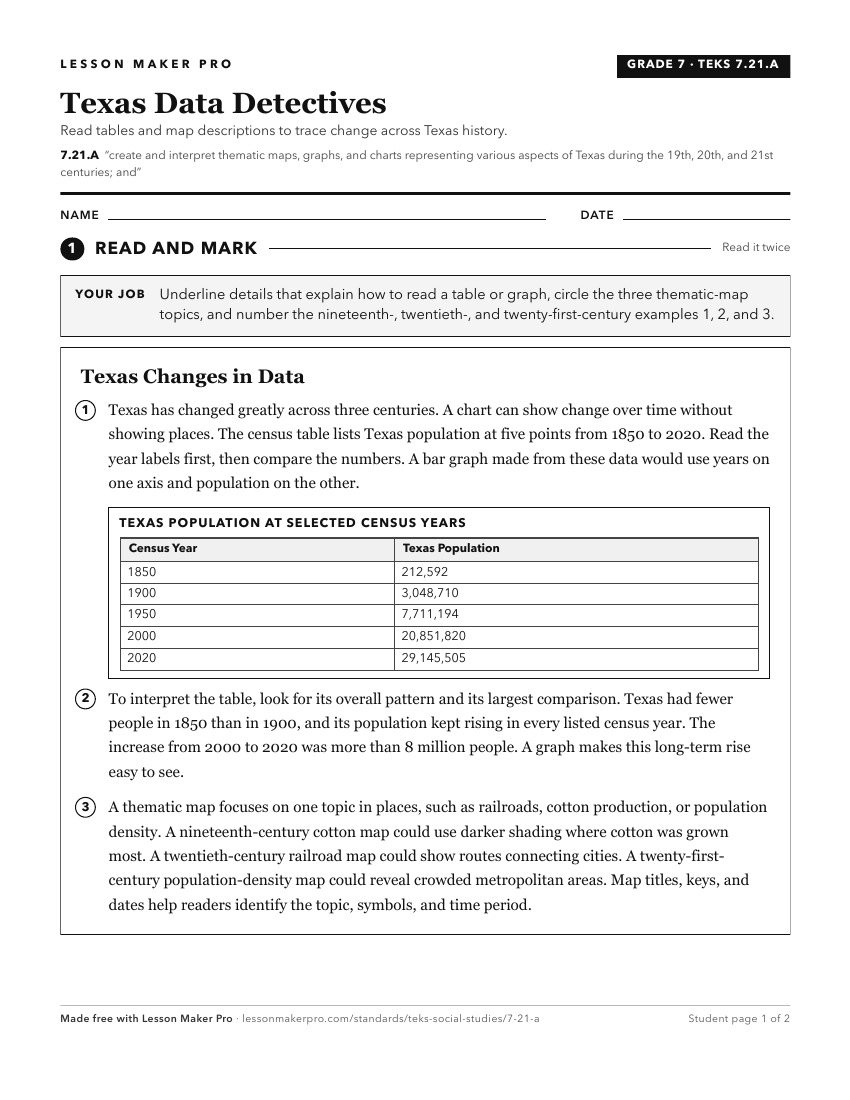
A ready-to-print activity worksheet aligned to 7.21.A, with an answer key for the teacher on its own page. No account needed.
PDF, US Letter, prints cleanly in black and white.
Download the worksheetKeep exploring
Related Standards
- 3.14.D
interpret and create visuals, including graphs, charts, tables, timelines, illustrations, and maps
- 8.29.G
create a visual representation of historical information such as thematic maps, graphs, and charts representing various aspects of the United States
- 7.21.B
analyze and interpret geographic distributions and patterns in Texas during the 19th, 20th, and 21st centuries.
- K.14.D
create and interpret visuals, including pictures and maps
Turn this exact standard into a lesson
Grade, subject, topic, and the complete standard are prefilled. Create one free, no account needed.
Also for this standard:Make a WorksheetMake a QuizMake a Sub Lesson