Texas TEKS 7.21.B
The Standard
- 7.21
- Social studies skills. The student uses geographic tools to collect, analyze, and interpret data. The student is expected to:
analyze and interpret geographic distributions and patterns in Texas during the 19th, 20th, and 21st centuries.
Texas Essential Knowledge and Skills for Social Studies
Teacher's field guide
What This Standard Means
What Students Need to Do
- Students read maps, graphs, and tables to find where people, cities, industries, and resources were located across Texas. They compare different time periods and explain changes using geographic and historical evidence.
What Mastery Looks Like
- Students identify clusters, gaps, movement, and regional differences in Texas data. They support a claim about change over time with accurate evidence from two or more sources.
Common Misconceptions
- Students may describe a map without identifying a pattern or explaining why it occurred. They may assume population grew evenly across Texas or confuse total population with population density.
How to Assess It
- Give students Texas population maps from 1900 and 2020. Ask them to identify one major shift and explain it with two map details.
Lesson moves
Ways to Teach It
Give groups Texas population maps from 1850, 1950, and 2020, then use sticky notes to mark growth areas and shifts.
Ask students to write: Why did Texas population growth concentrate near major cities, transportation routes, and water sources?
Play Map Evidence Match, where students pair pattern cards such as urban growth or migration with supporting maps and data.
Compare local census maps from two decades, then have students explain how housing, roads, or businesses changed nearby.
Free download
Printable 7.21.B Worksheet
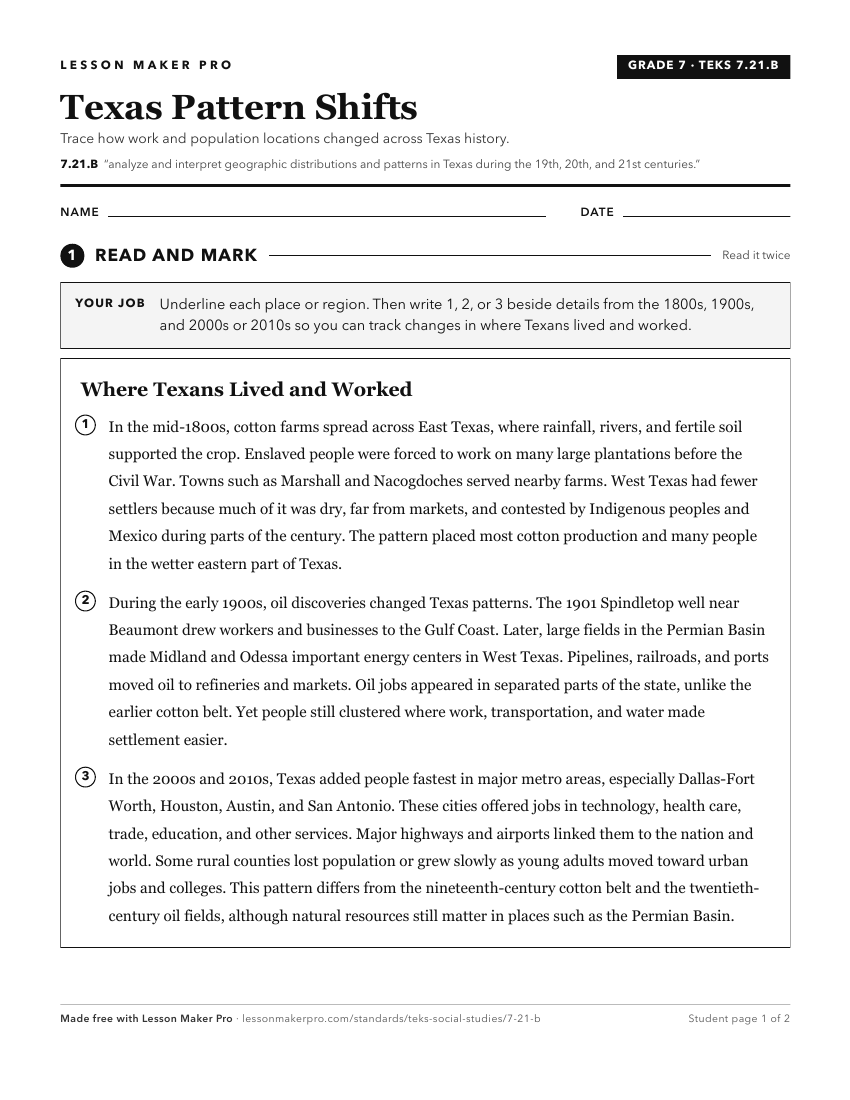
A ready-to-print activity worksheet aligned to 7.21.B, with an answer key for the teacher on its own page. No account needed.
PDF, US Letter, prints cleanly in black and white.
Download the worksheetKeep exploring
Related Standards
- 4.7.B
identify and explain patterns of settlement such as the location of towns and cities in Texas at different time periods.
- 4.7.A
explain the geographic factors such as landforms and climate that influence patterns of settlement and the distribution of population in Texas, past and present
- 7.21.A
create and interpret thematic maps, graphs, and charts representing various aspects of Texas during the 19th, 20th, and 21st centuries
- 7.10
Geography. The student understands the characteristics, distribution, and migration of population in Texas in the 19th, 20th, and 21st centuries. The student is...
Turn this exact standard into a lesson
Grade, subject, topic, and the complete standard are prefilled. Create one free, no account needed.
Also for this standard:Make a WorksheetMake a QuizMake a Sub Lesson