Texas TEKS 3.14.D
The Standard
- 3.14
- Social studies skills. The student applies critical-thinking skills to organize and use information acquired from a variety of valid sources, including technology. The student is expected to:
interpret and create visuals, including graphs, charts, tables, timelines, illustrations, and maps
Texas Essential Knowledge and Skills for Social Studies
Teacher's field guide
What This Standard Means
What Students Need to Do
- Students read titles, labels, keys, scales, and symbols to find information in a visual. They organize information into a clear visual and choose a format that fits the information.
What Mastery Looks Like
- Students answer questions accurately and point to evidence in the visual. They create a readable visual with correct data, labels, spacing, and a title.
Common Misconceptions
- Students may ignore a map key, misread a graph scale, or treat timeline spacing as unimportant. They may copy data incorrectly or leave out titles and labels.
How to Assess It
- Give students this data: cats 8, dogs 5, fish 3. Ask them to create a labeled bar graph and write one comparison supported by it.
Lesson moves
Ways to Teach It
Use sticky notes to build a class bar graph of favorite recess activities, then add a title, labels, and scale.
Show a map and timeline of the same trip, then ask students what each visual explains best and why.
Play Visual Detective by giving teams cards with graphs, maps, tables, and timelines plus questions to answer for points.
Use a weekly weather report to create a temperature table and graph, then identify the warmest and coolest days.
Free download
Printable 3.14.D Worksheet
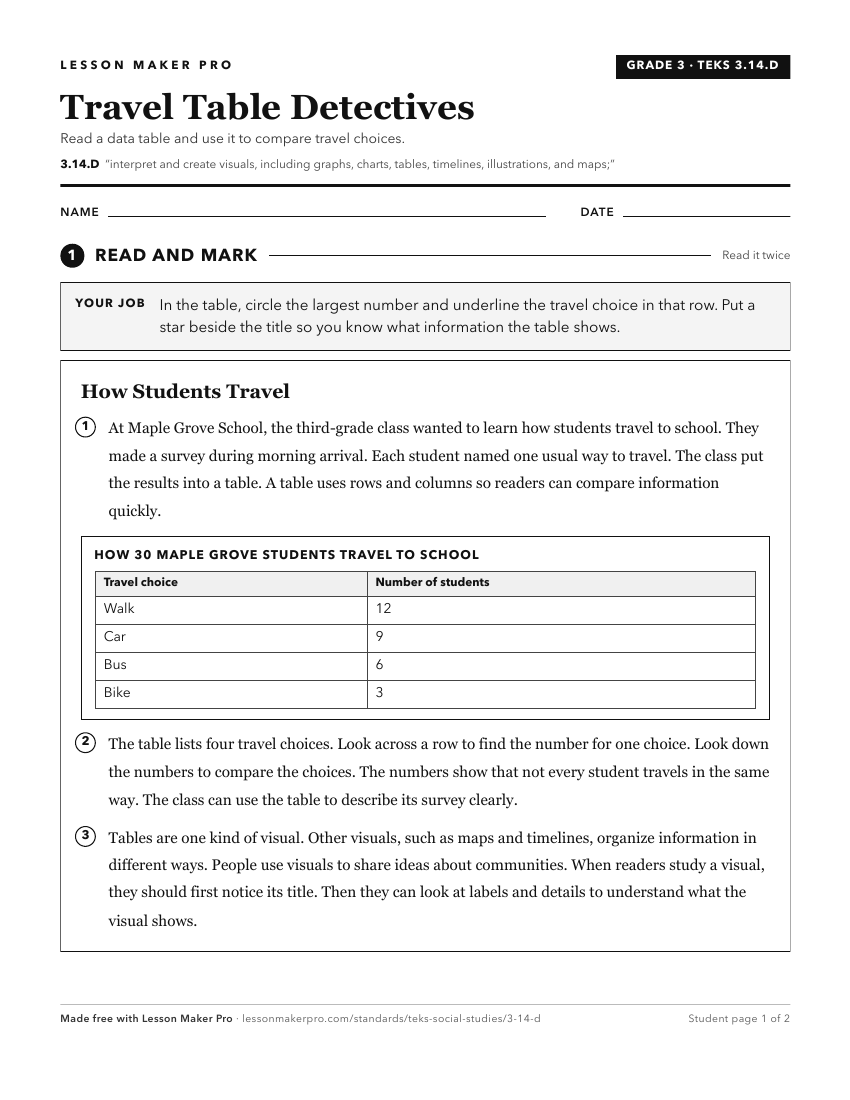
A ready-to-print activity worksheet aligned to 3.14.D, with an answer key for the teacher on its own page. No account needed.
PDF, US Letter, prints cleanly in black and white.
Download the worksheetKeep exploring
Related Standards
- 7.20.C
organize and interpret information from outlines, reports, databases, and visuals, including graphs, charts, timelines, and maps
- 5.23.D
organize and interpret information in outlines, reports, databases, and visuals, including graphs, charts, timelines, and maps
- K.14.D
create and interpret visuals, including pictures and maps
- 4.19.D
organize and interpret information in outlines, reports, databases, and visuals, including graphs, charts, timelines, and maps
Turn this exact standard into a lesson
Grade, subject, topic, and the complete standard are prefilled. Create one free, no account needed.
Also for this standard:Make a WorksheetMake a QuizMake a Sub Lesson