Oklahoma Social Studies 6.P.2.4
Standard Cluster
- 6.P.2
- Use interdisciplinary tools to acquire, apply, and evaluate content understanding of the four strands of social studies.
Identify the principles of economic systems and develop an understanding of the benefits of a market system in local, national, and global settings. Analyze, interpret, and compare economic data from multiple charts and graphs. Identify different types of economic systems, comparing advantages and disadvantages for citizens and the growth of a nation’s economy. Explain how technology and trade impact standard of living and economic interdependence, using historical or contemporary examples.
Oklahoma Academic Standards for Social Studies (2026) · 6.P.2
Cluster contents
Standards in This Cluster
6.P.2.4 is a cluster heading. These are the individual standards under it.
- 6.P.2.4.A
Analyze, interpret, and compare economic data from multiple charts and graphs.
- 6.P.2.4.B
Identify different types of economic systems, comparing advantages and disadvantages for citizens and the growth of a nation’s economy.
- 6.P.2.4.C
Explain how technology and trade impact standard of living and economic interdependence, using historical or contemporary examples.
Teacher's field guide
What This Cluster Means
What Students Need to Do
- Students explain how traditional, command, and market economies decide what to make and who gets it. They compare economic data in two charts and weigh benefits and drawbacks of market choices. They use local, national, and global examples to explain how trade and technology affect living standards and connect places.
What Mastery Looks Like
- A student can compare two graphs without claiming that one trend caused the other. They can name a market benefit, such as more choice, and a drawback, such as unequal access. They can explain how an imported product or new tool changes prices, jobs, or what people can buy.
Common Misconceptions
- Students may think a market has no rules, or that a command economy has no buying or selling. They may treat two rising lines as proof that one caused the other. They may assume cheaper imports help everyone and overlook workers facing new competition.
How to Assess It
- Give students two small bar charts: exports rise from 10 to 20 units, and income per person rises from $100 to $150. Ask them to describe both changes, name one possible benefit of trade, and explain why the charts do not prove trade caused the income change.
Lesson moves
Ways to Teach It
Run a pencil market with paper tokens, then distribute pencils by teacher assignment; record who received a pencil and who wanted one.
Ask, “If the school store buys cheaper imported notebooks, who gains, who might lose, and how do trade links connect places?”
Draw two bar charts, exports A:10 B:20 and income A:100 B:150; teams score for cross-chart comparisons, not causal claims.
Map an Ecuadorian banana’s trip to a local store; mark refrigerated shipping and explain how a shipping delay changes price and choice.
Free download
Printable 6.P.2.4 Worksheet
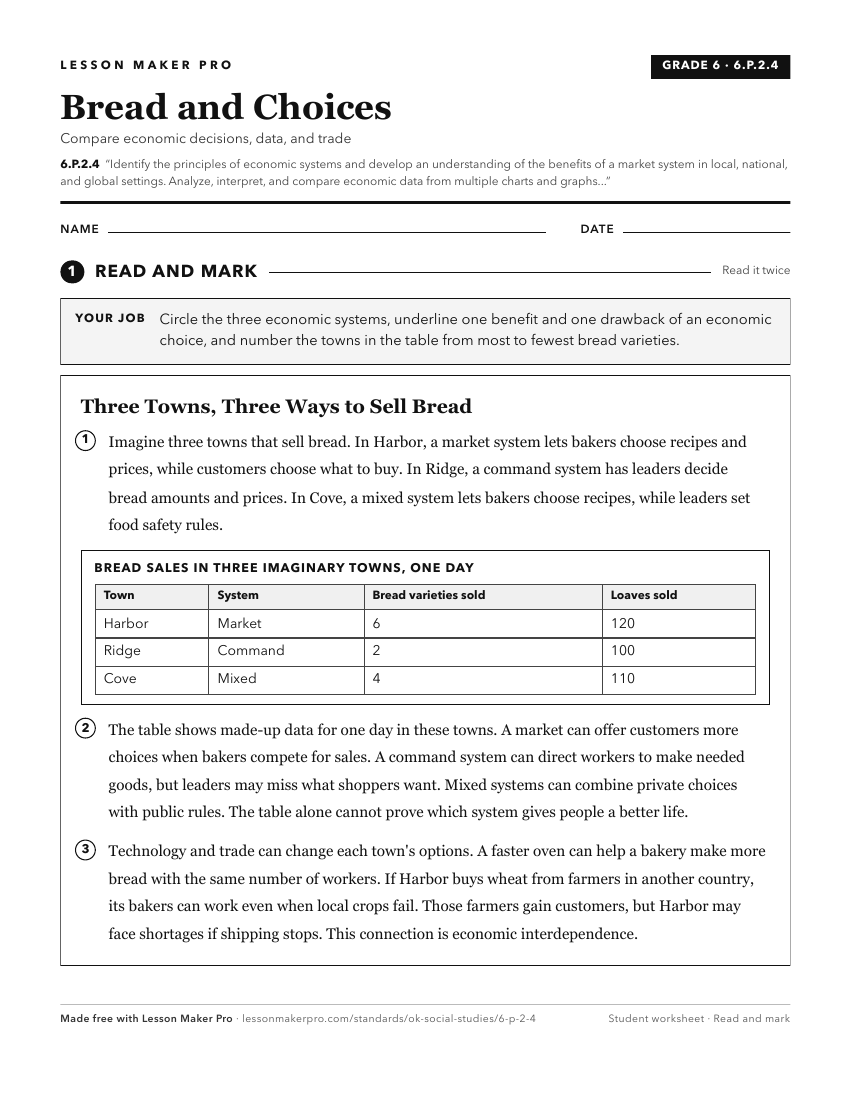
A ready-to-print activity worksheet aligned to 6.P.2.4, with an answer key for the teacher on its own page. No account needed.
PDF, US Letter, prints cleanly in black and white.
Download the worksheetKeep exploring
Related Standards
- E.P.2.4
Identify the principles of economic systems and develop an understanding of the benefits of a market system in local, national, and global settings.
- WG.P.2.4
Identify the principles of economic systems and develop an understanding of the benefits of a market system in local, national, and global settings.
- AWH.P.2.4
Identify the principles of economic systems and develop an understanding of the benefits of a market system in local, national, and global settings.
- 3.P.2.4
The 3rd Grade version of this standard.
Turn this cluster into a lesson
Grade, subject, topic, and the complete cluster are prefilled. Create one free, no account needed.
Also for this cluster:Make a WorksheetMake a QuizMake a Sub Lesson