Oklahoma Social Studies AWH.P.2.4
Standard Cluster
Identify the principles of economic systems and develop an understanding of the benefits of a market system in local, national, and global settings. Evaluate economic data from charts and graphs, noting trends and making predictions. Construct arguments using a combination of evidence regarding solutions used by nations to address historical or contemporary economic issues. Evaluate the impact, both intended and unintended, of government policies on market outcomes at national and global levels, past and present.
Oklahoma Academic Standards for Social Studies (2026)
Cluster contents
Standards in This Cluster
AWH.P.2.4 is a cluster heading. These are the individual standards under it.
- AWH.P.2.4.A
Evaluate economic data from charts and graphs, noting trends and making predictions.
- AWH.P.2.4.B
Construct arguments using a combination of evidence regarding solutions used by nations to address historical or contemporary economic issues.
- AWH.P.2.4.C
Evaluate the impact, both intended and unintended, of government policies on market outcomes at national and global levels, past and present.
Teacher's field guide
What This Cluster Means
What Students Need to Do
- Students compare how market and planned economies set prices and distribute goods, including where competition helps buyers. They read charts and graphs to find trends and make predictions. They use evidence to argue how government policies change markets at home and abroad.
What Mastery Looks Like
- A student uses numbers from a chart to describe a trend and make a cautious prediction. They explain how competition can lower local prices and how a tariff can help domestic sellers but raise costs for shoppers. They support a policy choice with data and a past or current example.
Common Misconceptions
- Students may think market economies have no government rules, or that every price change comes from a policy. They may call one high data point a trend or treat a prediction as a fact. Some assume a tariff helps everyone in a country and overlook costs to shoppers and foreign sellers.
How to Assess It
- On the board, draw two bar charts: imported rice costs $4 before a tariff and $5 after; local rice sales rise from 50 to 70 bags. Ask students to name both changes, predict an effect on shoppers, and argue whether the tariff helps local sellers, citing the bars.
Lesson moves
Ways to Teach It
Assign half the class pencil-card sellers and half buyers with ten paper tokens; run student-set and fixed-price rounds, then tally trades.
Draw a bread supply-and-demand graph, then ask: 'Should the town cap prices? Cite the graph and name one unintended effect.'
Give teams a card labeled 2022: 6%, 2023: 5%, 2024: 4%, 2025: 3%; award points for graphing and defending a 2026 prediction.
Bring a grocery flyer showing imported and local rice prices; students predict how a $1 tariff might affect each price and seller.
Free download
Printable AWH.P.2.4 Worksheet
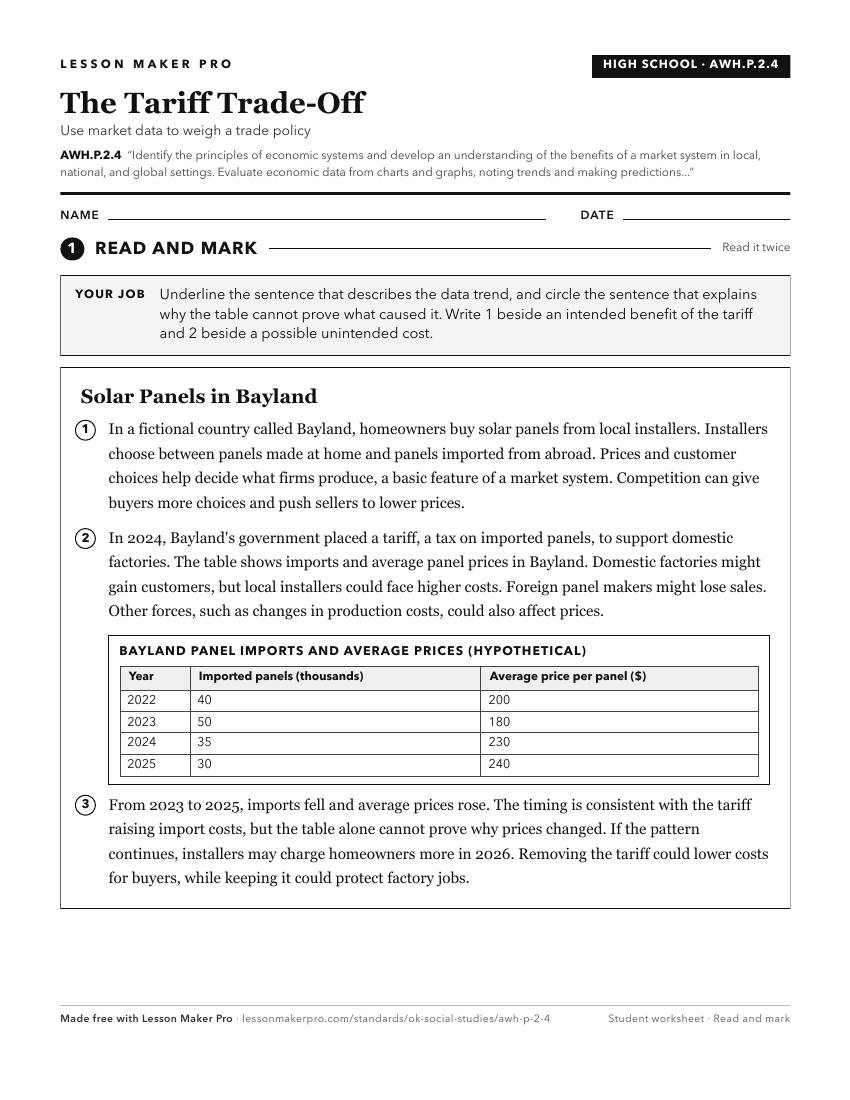
A ready-to-print activity worksheet aligned to AWH.P.2.4, with an answer key for the teacher on its own page. No account needed.
PDF, US Letter, prints cleanly in black and white.
Download the worksheetKeep exploring
Related Standards
- E.P.2.4
Identify the principles of economic systems and develop an understanding of the benefits of a market system in local, national, and global settings.
- USH.P.2.4
Identify the principles of economic systems and develop an understanding of the benefits of a market system in local, national, and global settings.
- 3.P.2.4
Identify the principles of economic systems and develop an understanding of the benefits of a market system in local, national, and global settings.
- 4.P.2.4
Identify the principles of economic systems and develop an understanding of the benefits of a market system in local, national, and global settings.
Turn this cluster into a lesson
Grade, subject, topic, and the complete cluster are prefilled. Create one free, no account needed.
Also for this cluster:Make a WorksheetMake a QuizMake a Sub Lesson