Oklahoma Social Studies AWH.P.2.4.A
The Standard
- AWH.P.2.4
- Identify the principles of economic systems and develop an understanding of the benefits of a market system in local, national, and global settings.
Evaluate economic data from charts and graphs, noting trends and making predictions.
Oklahoma Academic Standards for Social Studies (2026) · AWH.P.2.4
Teacher's field guide
What This Standard Means
What Students Need to Do
- Students read economic charts and graphs, including the axes, units, and scale. They describe how values change over time and use the data to make a reasonable prediction.
What Mastery Looks Like
- A student can point to two values that support a trend, such as prices rising from $2 to $3.50. They can predict a likely next value and explain why it is not certain.
Common Misconceptions
- Students may mistake a steep-looking line for a large change without checking the vertical scale. They may treat a prediction as a sure outcome or confuse a one percentage point change with a one percent change.
How to Assess It
- Draw a line graph showing unemployment at 8%, 6%, 5%, and 4% over four years. Ask students to describe the trend, predict year five, and cite two values that support their answer.
Lesson moves
Ways to Teach It
Pairs plot monthly egg prices of $2, $2.50, $3, and $3.50 on graph paper, label the axes, and predict month five.
Draw two wage charts using $12, $13, and $14, one starting at $0 and one at $11; ask which looks steeper and why.
Give pairs number cards marked 2, 3, 4, 5 and 8, 6, 4, 2; have them graph each set and predict the next value.
Post four weekly lunch prices of $4, $4.50, $5, and $5.50; ask whether three lunches next week will fit an $18 budget.
Free download
Printable AWH.P.2.4.A Worksheet
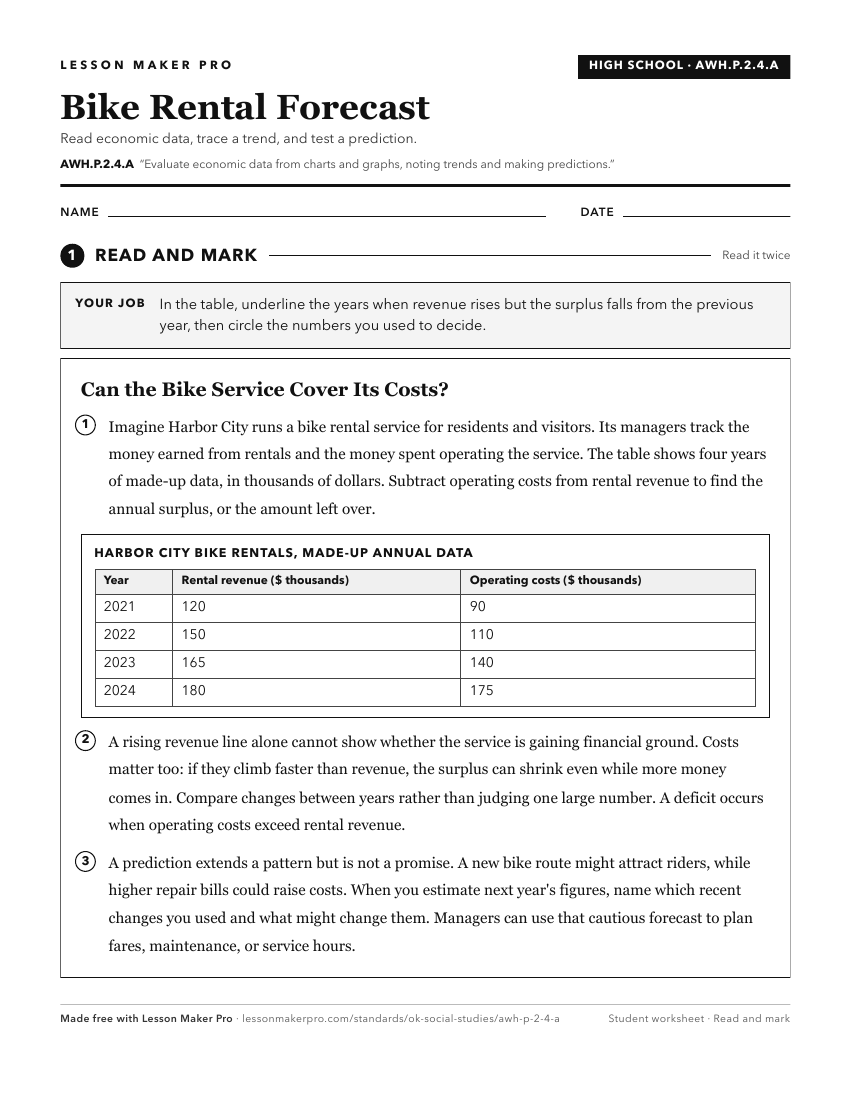
A ready-to-print activity worksheet aligned to AWH.P.2.4.A, with an answer key for the teacher on its own page. No account needed.
PDF, US Letter, prints cleanly in black and white.
Download the worksheetKeep exploring
Related Standards
- E.P.2.4.A
Evaluate economic data from charts and graphs, noting trends and making predictions.
- MWH.P.2.4.A
Evaluate economic data from charts and graphs, noting trends and making predictions.
- TOT.P.2.4.A
Evaluate economic data from charts and graphs, noting trends and making predictions.
- WG.P.2.4.A
Evaluate economic data from charts and graphs, noting trends and making predictions.
Turn this exact standard into a lesson
Grade, subject, topic, and the complete standard are prefilled. Create one free, no account needed.
Also for this standard:Make a WorksheetMake a QuizMake a Sub Lesson