Oklahoma Social Studies 6.C.1.2
Standard Cluster
- 6.C.1
- Analyze data from a geographic perspective using the skills and tools of geography.
Integrate visual information to organize understandings about the people and environments of the Western Hemisphere. Apply the concepts of scale, distance, and direction to explain the relative location of physical and human places using maps and globes; explain how various map projections are distorted. Use the system of latitude and longitude to identify the absolute location of a place on maps and globes. Use different types of maps, graphs, charts, and geographic tools, such as satellite imagery and Geographic Information System (GIS) technology to draw conclusions and make predictions from geographic data.
Oklahoma Academic Standards for Social Studies (2026) · 6.C.1
Cluster contents
Standards in This Cluster
6.C.1.2 is a cluster heading. These are the individual standards under it.
- 6.C.1.2.A
Apply the concepts of scale, distance, and direction to explain the relative location of physical and human places using maps and globes; explain how various ma...
- 6.C.1.2.B
Use the system of latitude and longitude to identify the absolute location of a place on maps and globes.
- 6.C.1.2.C
Use different types of maps, graphs, charts, and geographic tools, such as satellite imagery and Geographic Information System (GIS) technology to draw conclusi...
Teacher's field guide
What This Cluster Means
What Students Need to Do
- Students read maps, graphs, satellite images, and GIS layers to find patterns in where people live and what the land is like across the Western Hemisphere. They use scale, distance, direction, and coordinates to describe locations. They explain how flat maps distort the world and make predictions from geographic data.
What Mastery Looks Like
- A student can plot Quito from its latitude and longitude, then use a scale bar and compass rose to describe its distance and direction from Bogotá. They can explain why Greenland looks oversized on a Mercator map and use a population map and satellite image to predict where settlements might grow.
Common Misconceptions
- Students may swap latitude and longitude or leave off N, S, E, and W. They may compare distances on two maps without checking their scales. Some take Greenland’s large size on a Mercator map as its real size.
How to Assess It
- Hand out a Mercator map of the Western Hemisphere with a coordinate grid and scale bar. Ask students to plot 20° N, 100° W, estimate its distance and direction from Mexico City, and explain why Greenland looks oversized.
Lesson moves
Ways to Teach It
Cut out Greenland and South America from a printed Mercator map, then compare their apparent sizes with a globe.
Show a satellite image of the Amazon River and a nearby population map; ask, “Where might a new town grow, and why?”
Teams plot Mexico City (19° N, 99° W), Bogotá (5° N, 74° W), and Lima (12° S, 77° W) on a gridded map.
Find your town in FEMA’s flood map viewer, then estimate the distance and direction to the nearest mapped flood zone.
Free download
Printable 6.C.1.2 Worksheet
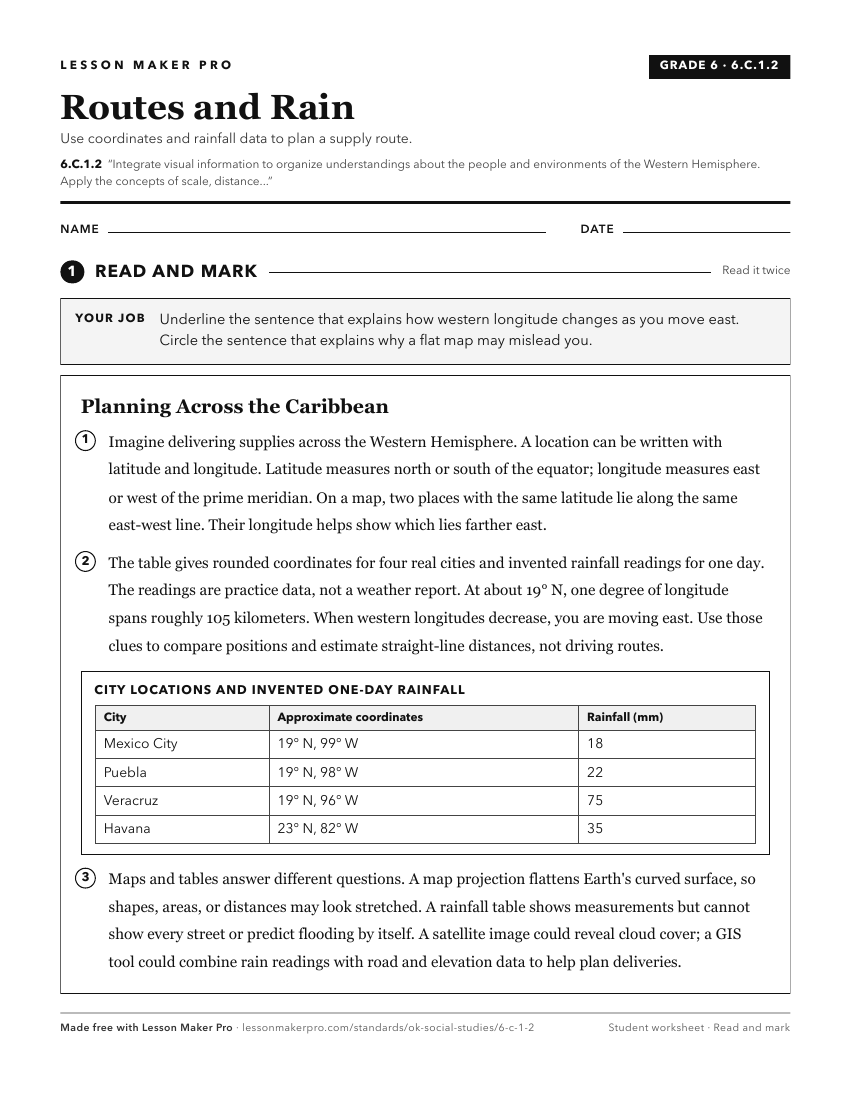
A ready-to-print activity worksheet aligned to 6.C.1.2, with an answer key for the teacher on its own page. No account needed.
PDF, US Letter, prints cleanly in black and white.
Download the worksheetKeep exploring
Related Standards
- 7.P.3.1.B
Integrate the use of visual information (e.g., maps, charts, photographs, videos, political cartoons, artwork) with textual information from primary and seconda...
- 6.C.4
Analyze the interactions of humans and their environment in the Western Hemisphere.
- 6.P.3.1.B
Integrate the use of visual information (e.g., maps, charts, photographs, videos, political cartoons, artwork) with textual information from primary and seconda...
- 8.P.3.1.B
Integrate the use of visual information (e.g., maps, charts, photographs, videos, political cartoons, artwork) with textual information from primary and seconda...
Turn this cluster into a lesson
Grade, subject, topic, and the complete cluster are prefilled. Create one free, no account needed.
Also for this cluster:Make a WorksheetMake a QuizMake a Sub Lesson