Oklahoma Social Studies 6.C.1.2.C
The Standard
- 6.C.1
- Analyze data from a geographic perspective using the skills and tools of geography.
- 6.C.1.2
- Integrate visual information to organize understandings about the people and environments of the Western Hemisphere.
Use different types of maps, graphs, charts, and geographic tools, such as satellite imagery and Geographic Information System (GIS) technology to draw conclusions and make predictions from geographic data.
Oklahoma Academic Standards for Social Studies (2026) · 6.C.1.2
Teacher's field guide
What This Standard Means
What Students Need to Do
- Students read maps, graphs, charts, and satellite images to spot patterns in a place. They use evidence from more than one source to explain a change and predict what might happen next. They can switch layers on a digital map to compare features.
What Mastery Looks Like
- Given dated images of Lake Mead and a water-level graph, a student identifies where the shoreline moved. They use both sources to predict where it might move if water levels keep falling.
Common Misconceptions
- Students may compare satellite images taken at different scales as though they show the same area. They may also assume a graph's trend will continue without checking its dates or considering that conditions could change.
How to Assess It
- Show two dated Lake Mead satellite images and a water-level graph covering those years. Ask: "What changed, and where might the shoreline be next if the trend continues? Use one detail from each source."
Lesson moves
Ways to Teach It
Use NASA Worldview to view Lake Mead in two years, then trace both shorelines on printed screenshots and circle exposed land.
Show a Lake Mead water-level graph and ask, "Does it fit the shoreline change? What might happen next, and why?"
Give pairs a road map, water-level graph, and satellite image; have them match each to claims about road access, water levels, and shoreline change.
Use a local flood-risk map and a three-day rain forecast to mark a nearby road that might flood after heavy rain.
Free download
Printable 6.C.1.2.C Worksheet
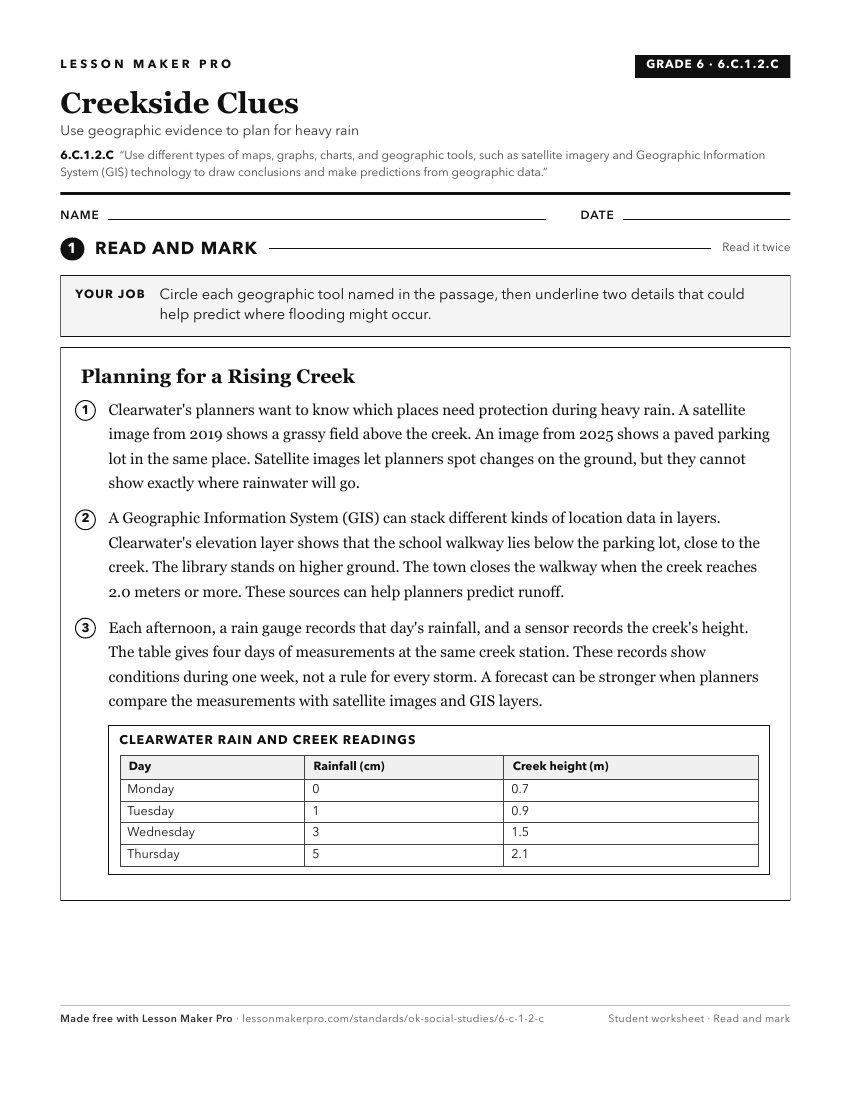
A ready-to-print activity worksheet aligned to 6.C.1.2.C, with an answer key for the teacher on its own page. No account needed.
PDF, US Letter, prints cleanly in black and white.
Download the worksheetKeep exploring
Related Standards
- 4.C.2.1.B
Use maps and other geographic representations (e.g., globes, charts, graphs) and geographic technologies to draw conclusions (e.g., settlement patterns, populat...
- 7.P.2.3.B
Use multiple mapping techniques, data visuals, satellite images, and geographic technology to analyze spatial patterns of physical and human characteristics, ma...
- 8.P.2.3.B
Use multiple mapping techniques, data visuals, satellite images, and geographic technology to analyze spatial patterns of physical and human characteristics, ma...
- 7.C.1.2
Reinforce geographic skills through the routine practice and use of geographic tools (e.g., thematic maps, graphs, charts, satellite imagery, GIS technologies) ...
Turn this exact standard into a lesson
Grade, subject, topic, and the complete standard are prefilled. Create one free, no account needed.
Also for this standard:Make a WorksheetMake a QuizMake a Sub Lesson