Oklahoma Math 7.D.1
Standard Cluster
Interpret and analyze data, creating the most appropriate display, using a variety of tools. Design simple experiments, collect data, and calculate measures of center (mean, median, and mode) and spread (range and interquartile range). Use these quantities to draw conclusions about the data collected and make predictions. Use reasoning with proportions to display and interpret data in circle graphs (pie charts) and histograms. Use technology to create and analyze box plots.
Oklahoma Academic Standards for Mathematics (2022)
Cluster contents
Standards in This Cluster
7.D.1 is a cluster heading. These are the individual standards under it.
- 7.D.1.1
Design simple experiments, collect data, and calculate measures of center (mean, median, and mode) and spread (range and interquartile range). Use these quantit...
- 7.D.1.2
Use reasoning with proportions to display and interpret data in circle graphs (pie charts) and histograms.
- 7.D.1.3
Use technology to create and analyze box plots.
Teacher's field guide
What This Cluster Means
What Students Need to Do
- Students run a simple experiment and record the results. They choose a graph that fits the data, then find the mean, median, mode, range, and interquartile range. They use proportions to read circle graphs and histograms, make box plots with a spreadsheet, and use the data to make predictions.
What Mastery Looks Like
- A student can turn survey counts into correctly sized circle slices. Given measurements, they can choose a histogram or box plot, calculate center and spread, and support a prediction with those numbers.
Common Misconceptions
- Students may leave gaps between histogram bars or treat circle slices as raw counts rather than parts of a whole. They may subtract the smallest value from the largest to find IQR, confusing it with range.
How to Assess It
- Exit ticket: For the times 2, 3, 3, 4, 4, 4, 6, 14 seconds, find the mean, median, mode, range, and IQR. Choose a display and predict the next time, using one number to explain your choice.
Lesson moves
Ways to Teach It
Drop a paper helicopter ten times with and without a paper clip; time each fall and record the two sets.
Compare the sets 2, 4, 6 and 0, 4, 8; ask which is more consistent and how the ranges show it.
Give teams lunch vote counts of 5, 4, 3, and 8; have them calculate each share and draw a circle graph.
Enter two weeks of local daily highs in a spreadsheet, make a histogram and box plots, then compare the medians and IQRs.
Free download
Printable 7.D.1 Worksheet
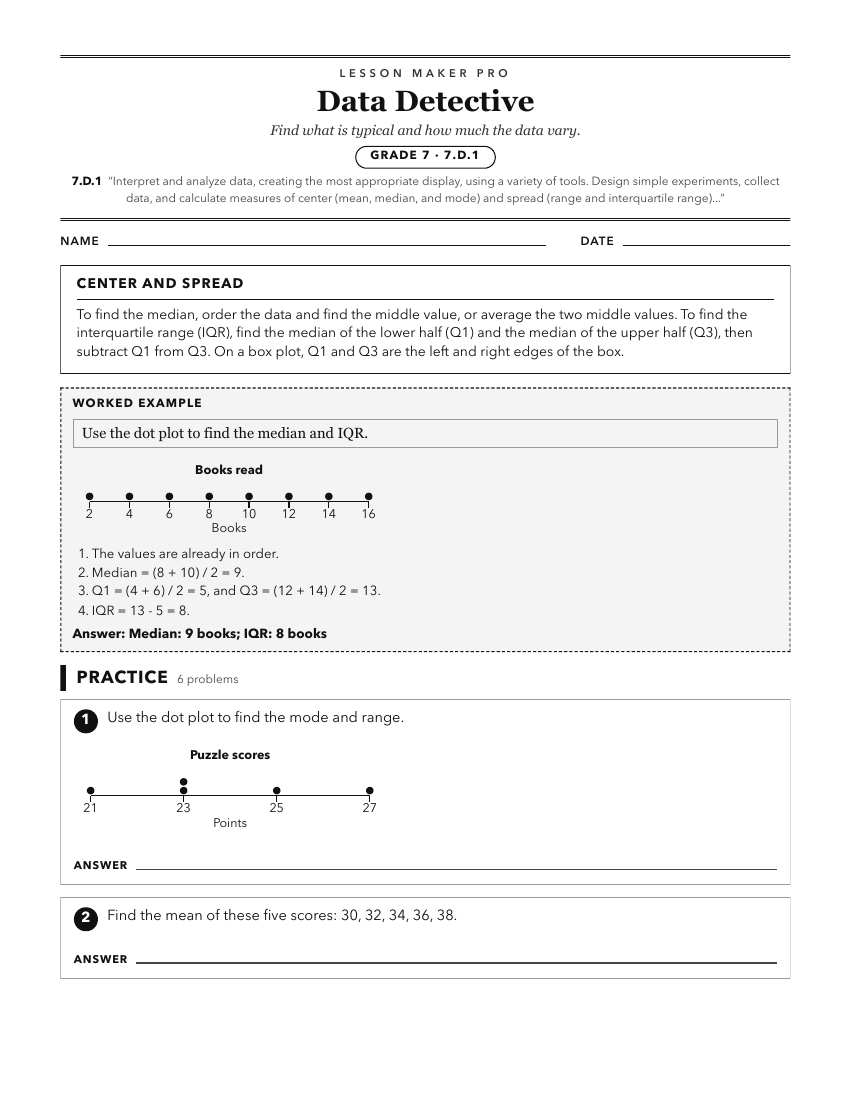
A ready-to-print activity worksheet aligned to 7.D.1, with an answer key for the teacher on its own page. No account needed.
PDF, US Letter, prints cleanly in black and white.
Download the worksheetKeep exploring
Related Standards
Turn this cluster into a lesson
Grade, subject, topic, and the complete cluster are prefilled. Create one free, no account needed.
Also for this cluster:Make a WorksheetMake a QuizMake a Sub Lesson