Oklahoma Math 2.D.1
Standard Cluster
Collect, organize, and interpret data. Explain that the length of a bar in a bar graph and the number of objects in a pictograph represents the number of data points for a given category. Organize a collection of data with up to four categories using pictographs and bar graphs in intervals of 1s, 2s, 5s or 10s. Write and solve one-step word problems involving addition or subtraction using data represented within pictographs and bar graphs with intervals of one. Draw conclusions and make predictions from information in a pictograph and bar graph.
Oklahoma Academic Standards for Mathematics (2022)
Cluster contents
Standards in This Cluster
2.D.1 is a cluster heading. These are the individual standards under it.
- 2.D.1.1
Explain that the length of a bar in a bar graph and the number of objects in a pictograph represents the number of data points for a given category.
- 2.D.1.2
Organize a collection of data with up to four categories using pictographs and bar graphs in intervals of 1s, 2s, 5s or 10s.
- 2.D.1.3
Write and solve one-step word problems involving addition or subtraction using data represented within pictographs and bar graphs with intervals of one.
- 2.D.1.4
Draw conclusions and make predictions from information in a pictograph and bar graph.
Teacher's field guide
What This Cluster Means
What Students Need to Do
- Students sort responses into up to four groups and show the totals in bar graphs and pictographs. They read scales and picture keys to find each group's count. On graphs counted by ones, they add or subtract counts to solve a story problem and use the data to make a prediction.
What Mastery Looks Like
- A student labels each category and uses the scale or picture key to show its count. They solve an addition or subtraction question from a graph counted by ones. They point to a count when explaining a prediction.
Common Misconceptions
- Students may count each bar square as one when the scale counts by fives. They may count each picture as one without checking the key. Some add counts when a question asks how many more.
How to Assess It
- Draw a bar graph showing 5 votes for apples, 3 for bananas, 2 for pears, and 4 for grapes, with each square worth one vote. Ask, "How many more votes did apples get than pears? Which fruit might get the most votes tomorrow, and why?"
Lesson moves
Ways to Teach It
Survey classmates about four recess games, then use one sticky note per vote to make a pictograph and a matching bar graph.
Draw a pictograph showing 6 pizza votes, 4 taco votes, and 2 sandwich votes; ask, "What might sell out first? Why?"
Give pairs cards marked cats 10, dogs 20, birds 30, and fish 40; have them race to draw a bar graph counting by tens.
Show a library checkout log with 5 comics, 3 mysteries, 2 animal books, and 4 sports books; graph the counts and predict tomorrow's favorite.
Free download
Printable 2.D.1 Worksheet
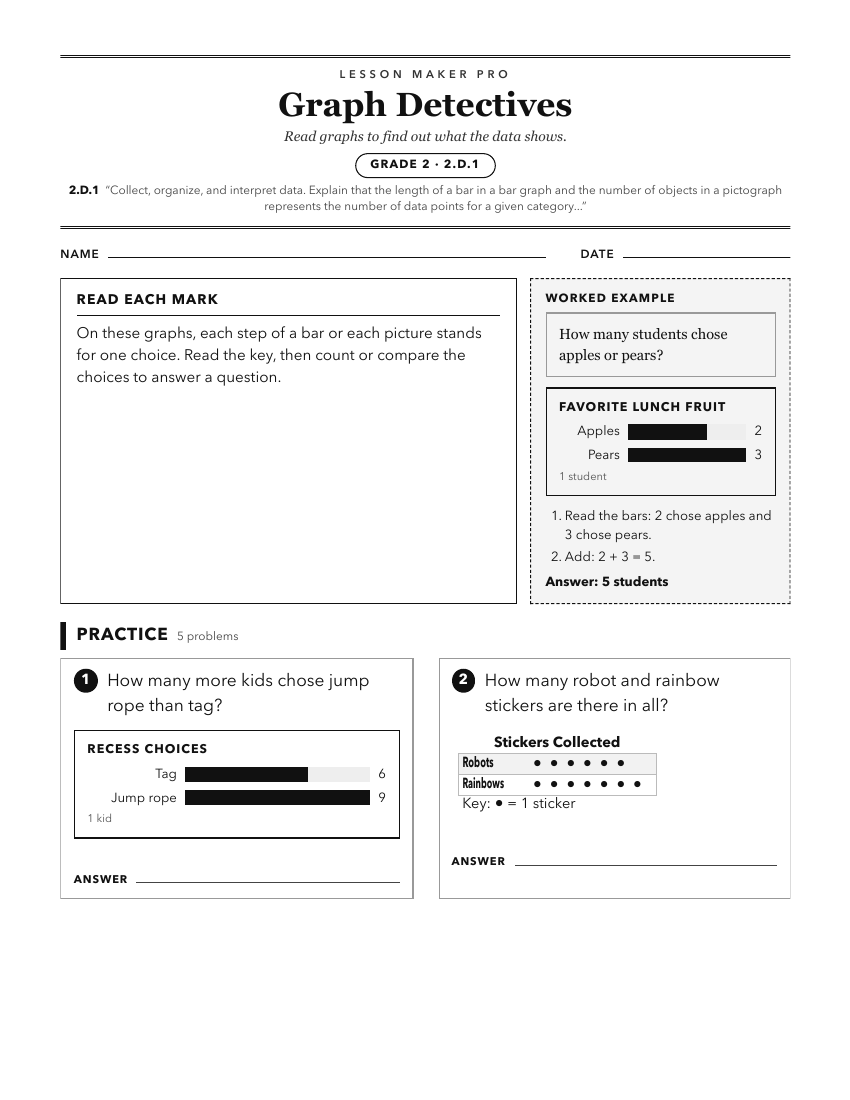
A ready-to-print activity worksheet aligned to 2.D.1, with an answer key for the teacher on its own page. No account needed.
PDF, US Letter, prints cleanly in black and white.
Download the worksheetKeep exploring
Related Standards
Turn this cluster into a lesson
Grade, subject, topic, and the complete cluster are prefilled. Create one free, no account needed.
Also for this cluster:Make a WorksheetMake a QuizMake a Sub Lesson