Oklahoma Math 2.D.1.4
The Standard
- 2.D.1
- Collect, organize, and interpret data.
Draw conclusions and make predictions from information in a pictograph and bar graph.
Oklahoma Academic Standards for Mathematics (2022)
Teacher's field guide
What This Standard Means
What Students Need to Do
- Students read the key on a pictograph and the number scale on a bar graph. They use the counts to draw conclusions and predict what might happen next.
What Mastery Looks Like
- A student can tell which group has more and by how many, using the graph as evidence. They can make a reasonable prediction and explain that it is a guess, not a sure result.
Common Misconceptions
- Students may count each picture as one even when the key says it stands for two. They may ignore the number scale on a bar graph. They may treat a prediction as something that must happen.
How to Assess It
- Give students a bar graph showing 6 votes for tag, 4 for soccer, and 2 for hopscotch. Ask, 'What do the votes tell you, and what might happen if the class votes again tomorrow? Use the bars to explain.'
Lesson moves
Ways to Teach It
Have students vote for a favorite fruit with sticky notes, build a pictograph, then draw a bar graph from the same votes.
Show a graph of class pet votes and ask, 'Which pet leads now? Do you think it would lead after three more votes? Why?'
Give pairs graph cards and claim cards; have them match each graph to a supported claim, then write a prediction.
Tally today's class lunch choices, draw a bar graph, and predict which choice may be most popular tomorrow.
Free download
Printable 2.D.1.4 Worksheet
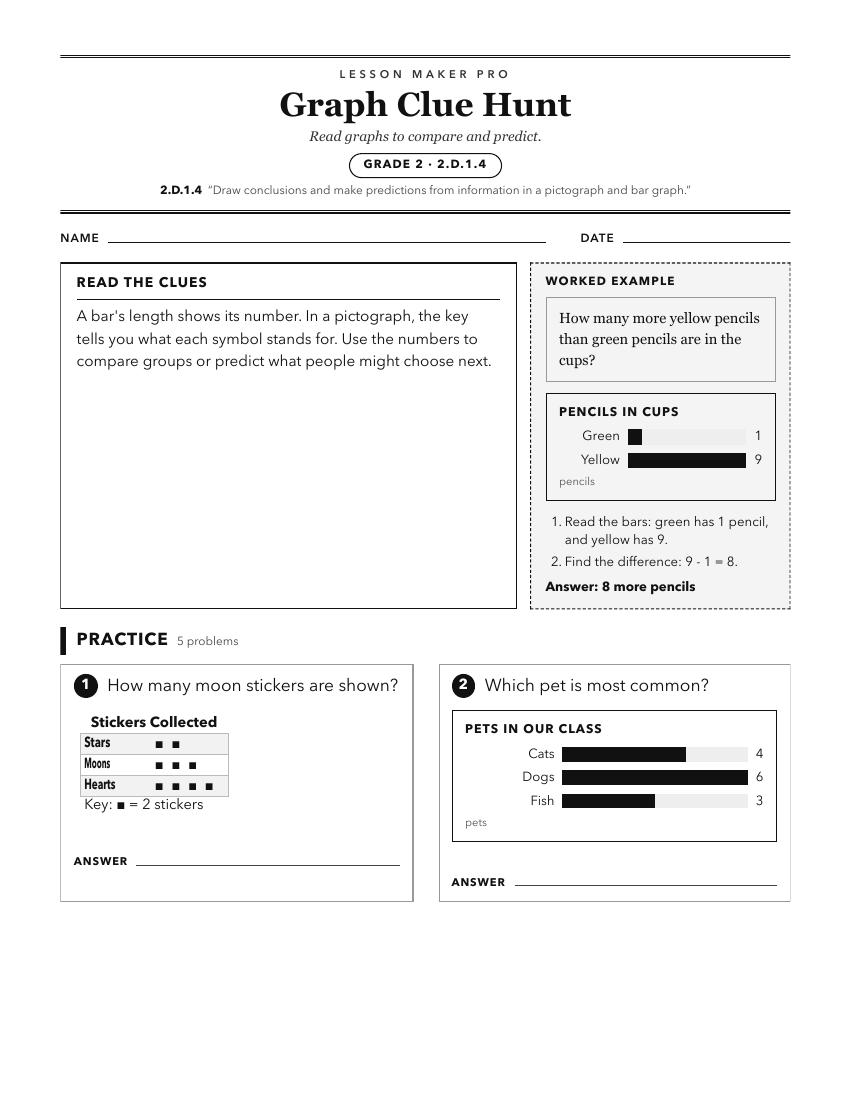
A ready-to-print activity worksheet aligned to 2.D.1.4, with an answer key for the teacher on its own page. No account needed.
PDF, US Letter, prints cleanly in black and white.
Download the worksheetKeep exploring
Related Standards
- 1.D.1.3
Draw conclusions from pictographs and bar graphs.
- K.D.1.3
Draw conclusions from real-object graphs and pictographs.
- 1.D.1.2
Use data to create pictographs and bar graphs that demonstrate one-to-one correspondence.
- 7.D.1.2
Use reasoning with proportions to display and interpret data in circle graphs (pie charts) and histograms.
Turn this exact standard into a lesson
Grade, subject, topic, and the complete standard are prefilled. Create one free, no account needed.
Also for this standard:Make a WorksheetMake a QuizMake a Sub Lesson