Oklahoma Math 1.D.1.2
The Standard
- 1.D.1
- Collect, organize, and interpret categorical and numerical data.
Use data to create pictographs and bar graphs that demonstrate one-to-one correspondence.
Oklahoma Academic Standards for Mathematics (2022)
Teacher's field guide
What This Standard Means
What Students Need to Do
- Students count responses in categories and make a pictograph or bar graph. Each picture or square stands for one response. They label the categories and read the counts.
What Mastery Looks Like
- Given four apple votes and two banana votes, a student labels both categories and draws four and two pictures or squares. The student points to each mark as one vote and says apples got two more votes.
Common Misconceptions
- Some students draw one picture for a whole category instead of one response. Others count grid lines rather than squares, or leave category names off the graph.
How to Assess It
- Give students this data: apples 4, bananas 2, grapes 3. Ask them to make a labeled bar graph on grid paper, using one square for each vote.
Lesson moves
Ways to Teach It
Have students place one counter per classmate on a floor graph of favorite fruits, then count the counters in each row.
Show three apple pictures beside a bar of three squares and ask, "How do both graphs show three votes?"
Give pairs vote cards and graph cards to match, checking that each picture or square stands for one vote.
Graph classmates' lunch choices with one sticky note per student, then tell the cafeteria which choice got the most votes.
Free download
Printable 1.D.1.2 Worksheet
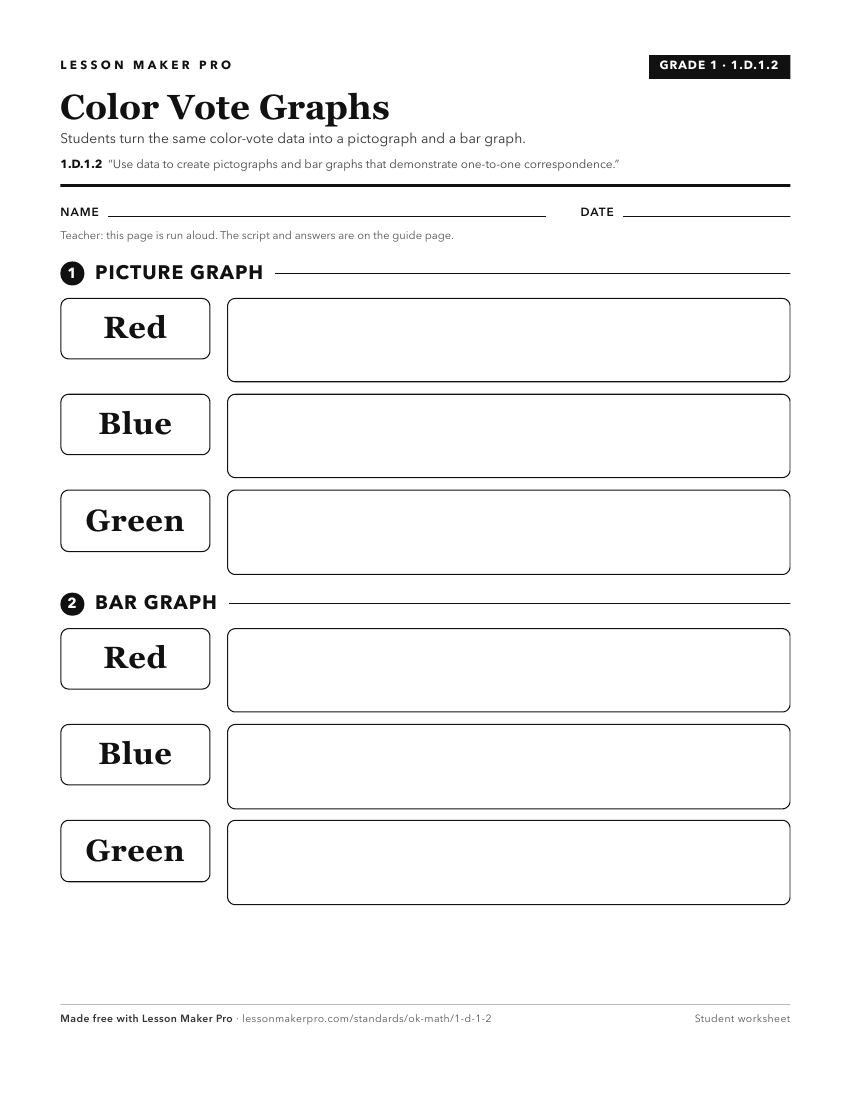
A ready-to-print activity worksheet aligned to 1.D.1.2, with an answer key for the teacher on its own page. No account needed.
PDF, US Letter, prints cleanly in black and white.
Download the worksheetKeep exploring
Related Standards
- 1.D.1.3
Draw conclusions from pictographs and bar graphs.
- K.D.1.2
Use categorical data to create real-object graphs and pictographs.
- 2.D.1.4
Draw conclusions and make predictions from information in a pictograph and bar graph.
- 2.D.1.3
Write and solve one-step word problems involving addition or subtraction using data represented within pictographs and bar graphs with intervals of one.
Turn this exact standard into a lesson
Grade, subject, topic, and the complete standard are prefilled. Create one free, no account needed.
Also for this standard:Make a WorksheetMake a QuizMake a Sub Lesson