Oklahoma Math 7.D.1.2
The Standard
- 7.D.1
- Interpret and analyze data, creating the most appropriate display, using a variety of tools.
Use reasoning with proportions to display and interpret data in circle graphs (pie charts) and histograms.
Oklahoma Academic Standards for Mathematics (2022)
Teacher's field guide
What This Standard Means
What Students Need to Do
- Students group number data into intervals and count the values in each group. They use each count's share of the total to make circle graphs and interpret both circle graphs and histograms.
What Mastery Looks Like
- A student can turn interval counts into fractions, percents, and circle angles that total 360°. They draw touching histogram bars at the correct heights and compare groups using either graph.
Common Misconceptions
- Students may leave gaps between histogram bars, as they would in a bar graph. They may confuse a group's count with its percent of the total or draw circle slices whose angles do not add to 360°.
How to Assess It
- Exit ticket: Of 20 students, 5 read 0–9 minutes, 10 read 10–19, and 5 read 20–29. Draw a histogram and circle graph, label the bar heights and sector angles, and state the proportion in the middle interval.
Lesson moves
Ways to Teach It
Give pairs 20 reading-time slips; sort them into 10-minute intervals, stack sticky notes for histogram bars, and draw circle sectors with protractors.
Ask: If 10 of 20 students read 10–19 minutes, what should that interval look like on each graph, and why?
Play a matching game with cards showing interval counts, histogram bars, and circle sectors; have students explain each match.
Record page counts from 20 classroom library books; group them into 100-page intervals and chart the groups for a shelf display.
Free download
Printable 7.D.1.2 Worksheet
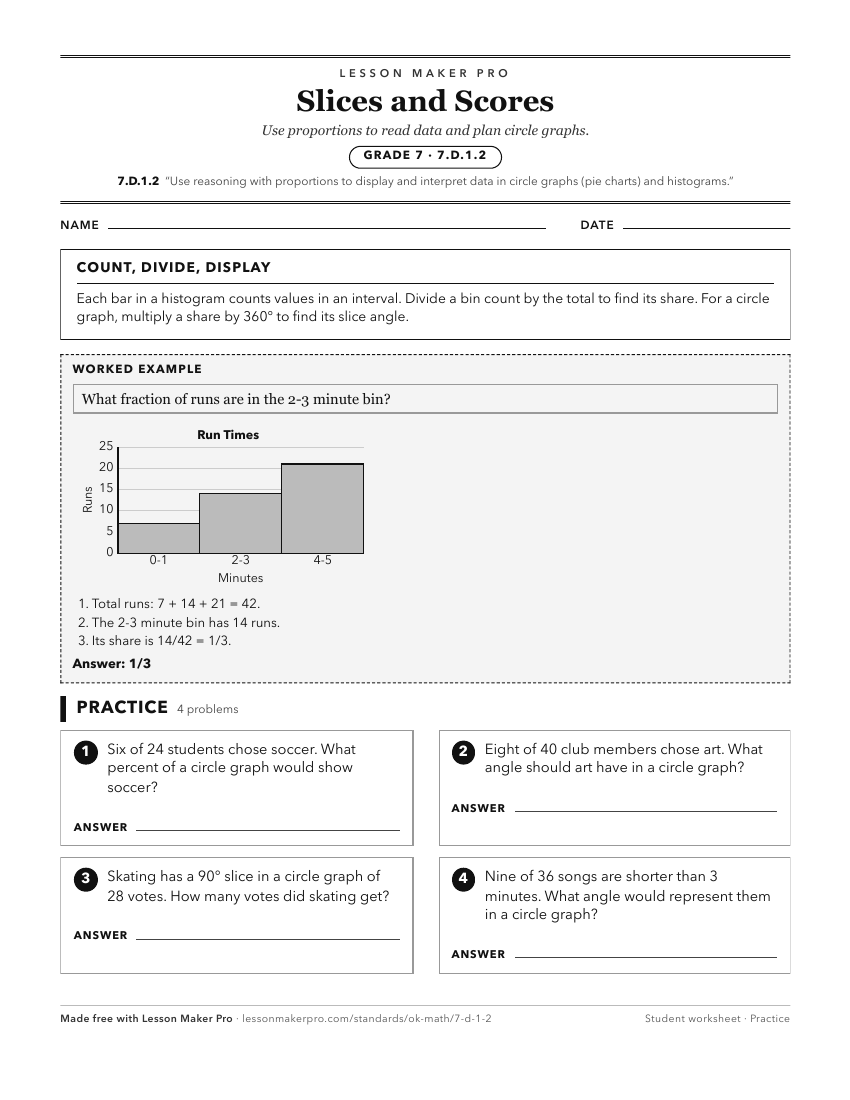
A ready-to-print activity worksheet aligned to 7.D.1.2, with an answer key for the teacher on its own page. No account needed.
PDF, US Letter, prints cleanly in black and white.
Download the worksheetKeep exploring
Related Standards
- 1.D.1.3
Draw conclusions from pictographs and bar graphs.
- 2.D.1.4
Draw conclusions and make predictions from information in a pictograph and bar graph.
- PA.D.1
Display and interpret data in a variety of ways, including using scatter plots and approximate lines of best fit. Use the line of best fit and average rate of c...
- PA.D.1.3
Collect, display, and interpret data using scatter plots. Use the shape of the scatter plot to find the informal line of best fit, make statements about the ave...
Turn this exact standard into a lesson
Grade, subject, topic, and the complete standard are prefilled. Create one free, no account needed.
Also for this standard:Make a WorksheetMake a QuizMake a Sub Lesson