Oklahoma Math 7.D.1.3
The Standard
- 7.D.1
- Interpret and analyze data, creating the most appropriate display, using a variety of tools.
Use technology to create and analyze box plots.
Oklahoma Academic Standards for Mathematics (2022)
Teacher's field guide
What This Standard Means
What Students Need to Do
- Students enter numerical data into a graphing tool to make a box plot. They identify the median, quartiles, and endpoints, then compare the spread of two data sets.
What Mastery Looks Like
- A student can make a box plot from a data list using technology. They can use the median and the width of the box to explain how two data sets differ.
Common Misconceptions
- Some students read the line inside the box as the mean instead of the median. Others think a wider box means more data points, rather than more spread in the middle half.
How to Assess It
- Type BoxPlot(0, 1, {2, 3, 3, 4, 5, 6, 7, 8, 9}) into GeoGebra. Write the median and explain what the box represents.
Lesson moves
Ways to Teach It
Have students measure ten paper strips with rulers, enter the lengths into GeoGebra, and mark the median and quartiles on the box plot.
Plot {2, 4, 5, 7, 8, 9, 11} and {1, 3, 5, 7, 9, 11, 13}; ask which middle half is more spread out.
Pairs match {1, 2, 3, 4, 5}, {1, 1, 3, 5, 5}, and {1, 3, 3, 3, 5} to three box plots.
Plot two weeks of bus delays, {0, 2, 2, 4, 7} and {0, 0, 2, 2, 3} minutes; choose the more predictable week.
Free download
Printable 7.D.1.3 Worksheet
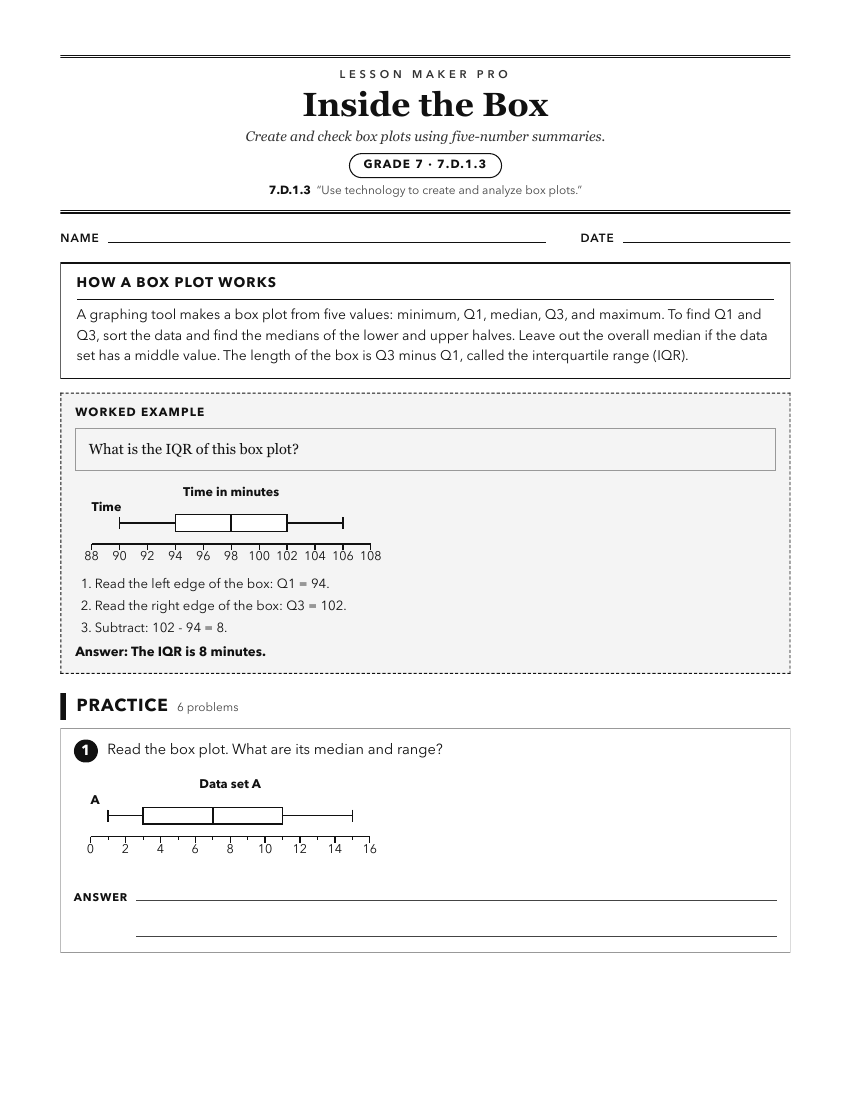
A ready-to-print activity worksheet aligned to 7.D.1.3, with an answer key for the teacher on its own page. No account needed.
PDF, US Letter, prints cleanly in black and white.
Download the worksheetKeep exploring
Related Standards
- S.DA.1.2
Select and create an appropriate display (e.g., dot plots, histograms, box plots) for univariate data.
- A1.D.1.2
Collect data and analyze scatter plots for patterns, linearity, and outliers.
- A1.D.1.1
Display, describe, and compare data sets using summary statistics (central tendency and spread (range)). Utilize technology (e.g., spreadsheets, calculators) to...
- 4.D.1.1
Create and organize data on a frequency table or line plot marked with whole numbers and fractions using appropriate titles, labels, and units.
Turn this exact standard into a lesson
Grade, subject, topic, and the complete standard are prefilled. Create one free, no account needed.
Also for this standard:Make a WorksheetMake a QuizMake a Sub Lesson