Oklahoma Math S.DA.1.2
The Standard
- S.DA.1
- Use distributions of quantitative and categorical data to identify the key features of the data collected in context.
Select and create an appropriate display (e.g., dot plots, histograms, box plots) for univariate data.
Oklahoma Academic Standards for Mathematics (2022)
Teacher's field guide
What This Standard Means
What Students Need to Do
- Students choose a display for one set of data, then make it. They use dot plots, histograms, or box plots for numbers, and bar graphs for categories.
What Mastery Looks Like
- A student can choose a graph that fits the data and the question. They label it, plot the values accurately, and explain what the display makes easy to see.
Common Misconceptions
- Students may use a box plot for categories or leave gaps between histogram bars. They may put values in the wrong histogram bins or forget to label the scale.
How to Assess It
- Give students these wait times in minutes: 2, 3, 3, 4, 4, 5, 5, 5, 6, 7, 9, 14. Ask them to choose and draw a display, then explain their choice in one sentence.
Lesson moves
Ways to Teach It
Have students place sticky notes on a number line to make a dot plot of their commute times.
Show a dot plot and a box plot of the same quiz scores, then ask which better shows repeated scores and why.
Give pairs data cards and graph cards, then have them match each data set to a useful display and sketch it.
Collect cafeteria wait times for one lunch period and make a histogram to see when long waits occur.
Free download
Printable S.DA.1.2 Worksheet
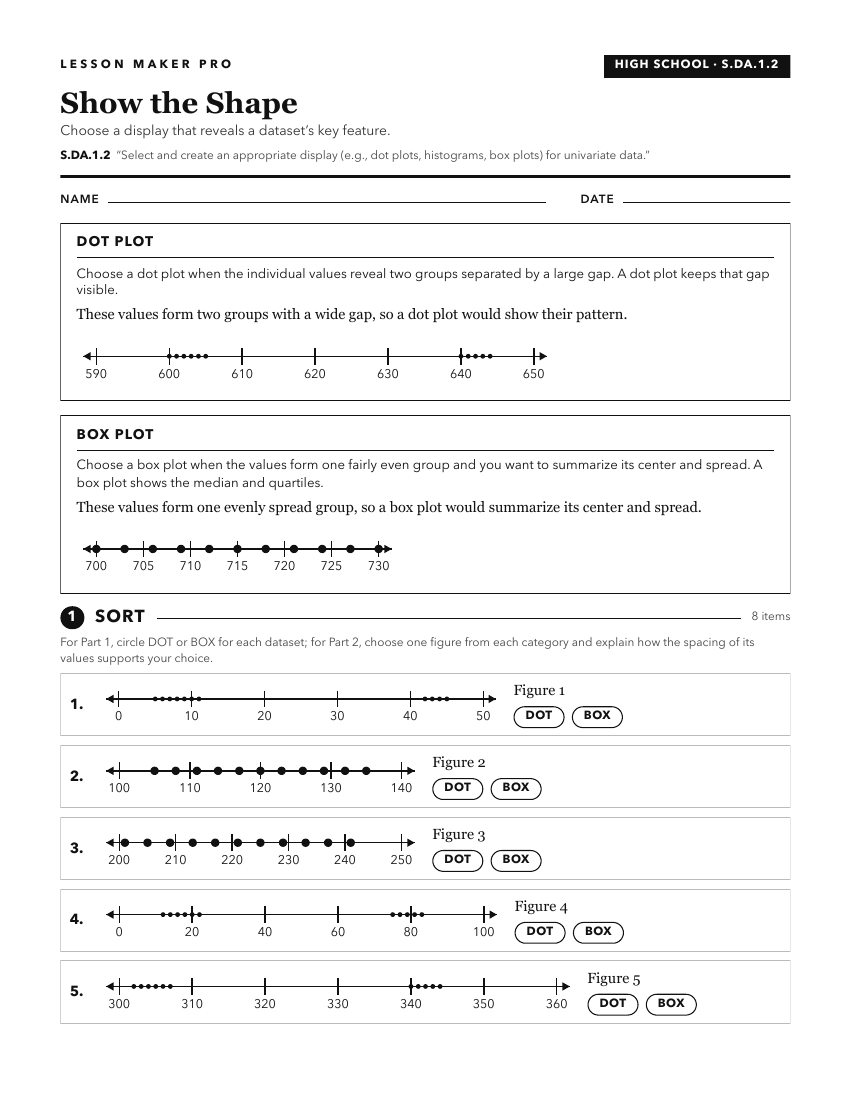
A ready-to-print activity worksheet aligned to S.DA.1.2, with an answer key for the teacher on its own page. No account needed.
PDF, US Letter, prints cleanly in black and white.
Download the worksheetKeep exploring
Related Standards
- 7.D.1.3
Use technology to create and analyze box plots.
- A1.D.1.1
Display, describe, and compare data sets using summary statistics (central tendency and spread (range)). Utilize technology (e.g., spreadsheets, calculators) to...
- 4.D.1.1
Create and organize data on a frequency table or line plot marked with whole numbers and fractions using appropriate titles, labels, and units.
- 7.D.1
Interpret and analyze data, creating the most appropriate display, using a variety of tools.
Turn this exact standard into a lesson
Grade, subject, topic, and the complete standard are prefilled. Create one free, no account needed.
Also for this standard:Make a WorksheetMake a QuizMake a Sub Lesson