Montana Math MT.PLUS.DATA.NORM.1
The Standard
Determine if a data set is normally distributed.
2026 Montana Mathematics Content Standards · Data Reasoning
Teacher's field guide
What This Standard Means
What Students Need to Do
- Students graph a data set and look for one central peak, roughly balanced sides, and fewer values toward both ends. They decide whether a normal model is reasonable, not whether the graph makes a perfect bell.
What Mastery Looks Like
- Given a histogram, a student can say whether a normal model is reasonable and point to features of its shape. They can explain why a skewed or two-peaked graph is a poor fit.
Common Misconceptions
- Students may call any symmetric graph normal, even one with two peaks. They may think matching mean and median prove a data set is normal. They may expect a small sample to make a perfectly smooth bell.
How to Assess It
- A histogram has seven equal-width bins with counts 1, 3, 7, 11, 7, 3, 1. Would a normal model be reasonable? Name two features of the shape that support your answer.
Lesson moves
Ways to Teach It
Measure 30 ruler-drop catches in centimeters, stack sticky notes in 5 cm bins, and check the histogram for one peak and tapering sides.
Show two symmetric histograms, one with one peak and one with two; ask students which could be normal and why.
Draw six histogram cards with bell-shaped, skewed, flat, and two-peaked examples; have pairs sort them by whether a normal model is reasonable.
Measure 30 used pencils, graph their lengths in 1 cm bins, and decide whether a normal model fits.
Free download
Printable MT.PLUS.DATA.NORM.1 Worksheet
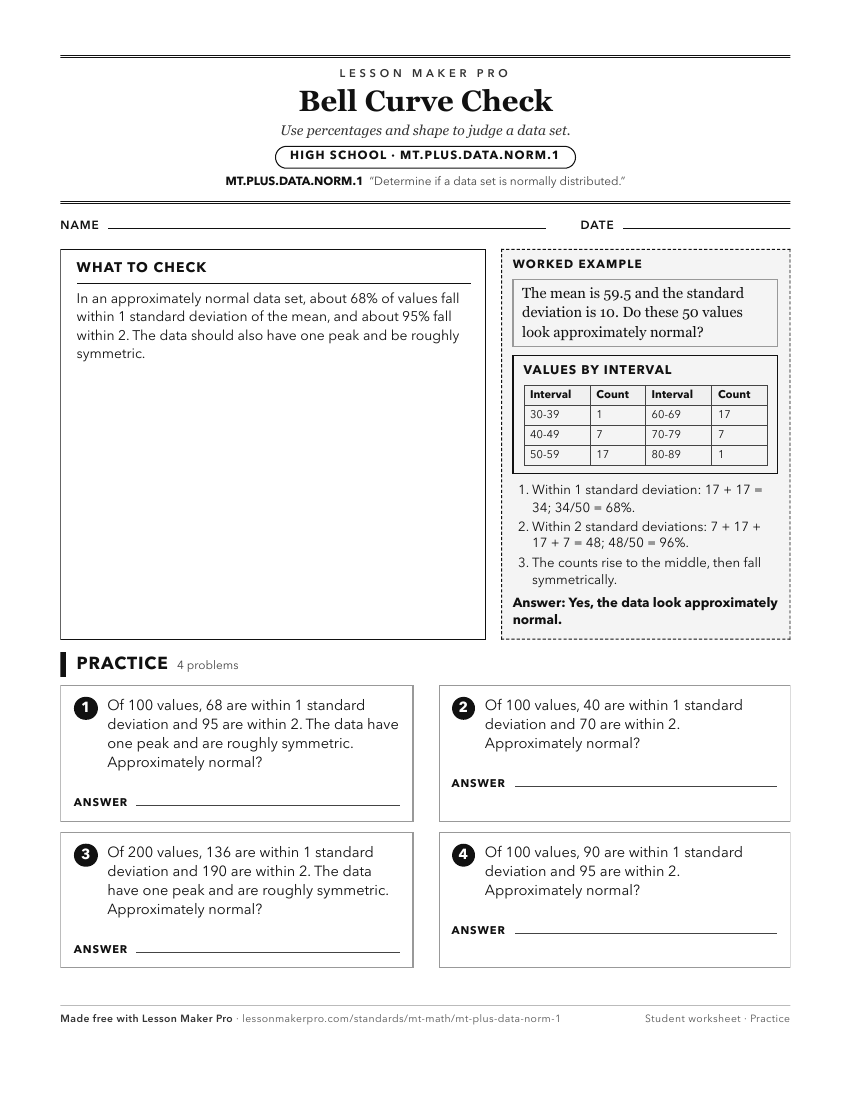
A ready-to-print activity worksheet aligned to MT.PLUS.DATA.NORM.1, with an answer key for the teacher on its own page. No account needed.
PDF, US Letter, prints cleanly in black and white.
Download the worksheetKeep exploring
Related Standards
- MT.7.SP.4
Use measures of central tendency and measures of variability for numerical data from random samples to draw comparative inferences about two populations.
- MT.7.SP.3
Visually analyze two data distributions to compare measures of central tendency and variability.
- MT.PLUS.DATA.NORM.2
Use technology to find the mean and standard deviation of a normally distributed data set and apply the empirical rule to estimate population percentages.
- MT.CORE.DATA.INT.4
Interpret differences in the shape, center, and spread of quantitative data distributions, in context, accounting for possible effects of outliers on measures o...
Turn this exact standard into a lesson
Grade, subject, topic, and the complete standard are prefilled. Create one free, no account needed.
Also for this standard:Make a WorksheetMake a QuizMake a Sub Lesson