Montana Math MT.PLUS.DATA.NORM.2
The Standard
Use technology to find the mean and standard deviation of a normally distributed data set and apply the empirical rule to estimate population percentages.
2026 Montana Mathematics Content Standards · Data Reasoning
Teacher's field guide
What This Standard Means
What Students Need to Do
- Students use a spreadsheet or calculator to find the mean and standard deviation of a roughly bell-shaped data set. They use the 68%, 95%, and 99.7% rule to estimate population percentages in ranges around the mean.
What Mastery Looks Like
- A student calculates the mean and standard deviation with technology and identifies the range one, two, or three standard deviations from the mean. If the mean is 170 cm and the standard deviation is 6 cm, they estimate that about 95% of values lie between 158 and 182 cm.
Common Misconceptions
- Students may put 95% of values within one standard deviation or treat the standard deviation as the full range. Some apply the rule to data with a long tail or two peaks.
How to Assess It
- Use a spreadsheet to find the mean and standard deviation of 40, 43, 45, 46, 47, 48, 49, 50, 50, 50, 51, 52, 53, 54, 55, 57, 60. Estimate the percentage of the population within two standard deviations of the mean, and give the score interval.
Lesson moves
Ways to Teach It
Sort 30 printed height cards into bins, then enter the heights in a spreadsheet and mark the mean plus or minus one standard deviation.
Write a reply to a student who claims that 95% of values lie within one standard deviation of the mean.
Play a matching game with score intervals and 68%, 95%, or 99.7% cards after calculating the mean and standard deviation in a spreadsheet.
Use a supplied spreadsheet of bell-shaped package weights to estimate what percent a factory would flag beyond two standard deviations.
Free download
Printable MT.PLUS.DATA.NORM.2 Worksheet
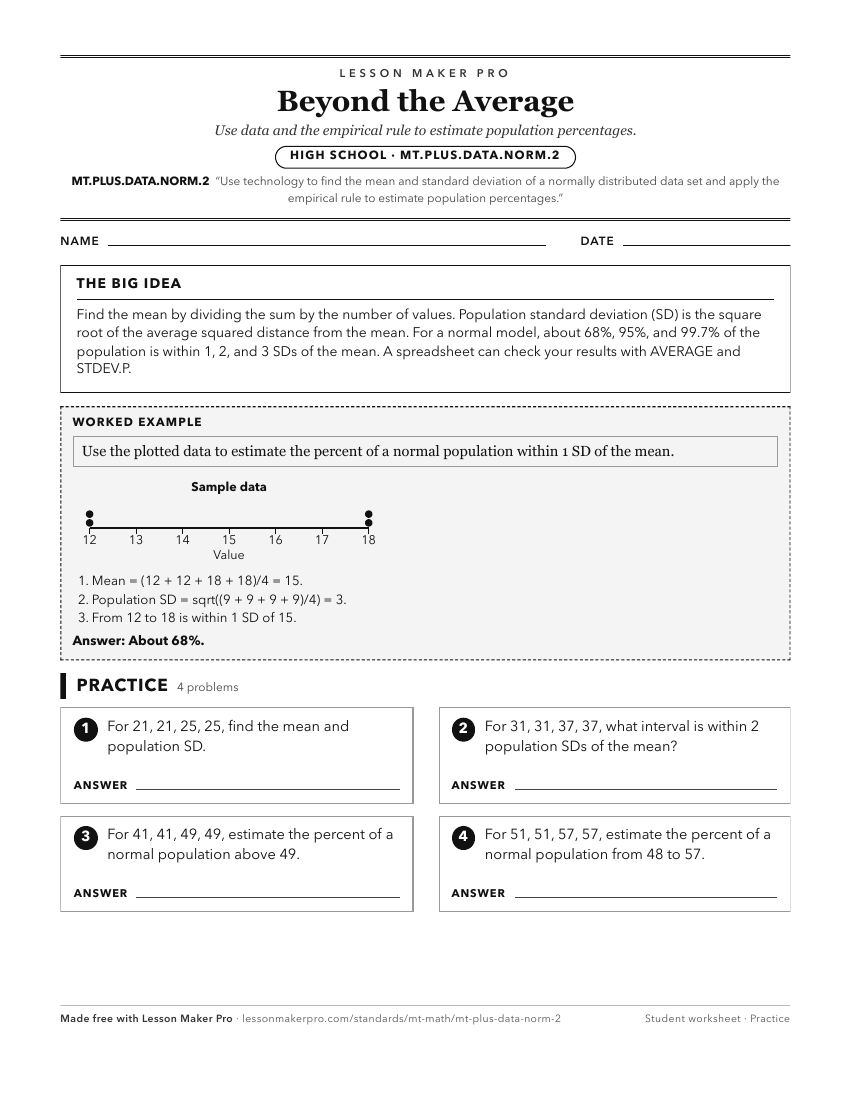
A ready-to-print activity worksheet aligned to MT.PLUS.DATA.NORM.2, with an answer key for the teacher on its own page. No account needed.
PDF, US Letter, prints cleanly in black and white.
Download the worksheetKeep exploring
Related Standards
- MT.CORE.DATA.INT.3
Understand that standard deviation measures the variability of a data distribution, and calculate standard deviation using technology.
- MT.PLUS.DATA.INF.2
Estimate a population parameter from a representative sample by: Understanding why the sample statistic is the best estimate for the associated population param...
- MT.PLUS.DATA.NORM.1
Determine if a data set is normally distributed.
- MT.PLUS.DATA.INF.2.b
Understanding that sampling variability introduces uncertainty in the estimate, and account for the uncertainty with a confidence interval by: Using resamplin...
Turn this exact standard into a lesson
Grade, subject, topic, and the complete standard are prefilled. Create one free, no account needed.
Also for this standard:Make a WorksheetMake a QuizMake a Sub Lesson