Montana Math MT.PLUS.DATA.INF.2
Standard Cluster
Estimate a population parameter from a representative sample by: Understanding why the sample statistic is the best estimate for the associated population parameter, Understanding that sampling variability introduces uncertainty in the estimate, and account for the uncertainty with a confidence interval by: Using resampling with replacement from an observed sample to produce a sampling distribution, Verifying that a sampling distribution is centered at the population mean and approximately normal if the sample size is large enough, Verifying that 95% of sample means are within two standard deviations of the sampling distribution from the population mean, and Creating and interpreting a 95% confidence interval based on an observed mean from a sampling distribution.
2026 Montana Mathematics Content Standards · Data Reasoning
Cluster contents
Standards in This Cluster
MT.PLUS.DATA.INF.2 is a cluster heading. These are the individual standards under it.
- MT.PLUS.DATA.INF.2.a
Understanding why the sample statistic is the best estimate for the associated population parameter,
- MT.PLUS.DATA.INF.2.b
Understanding that sampling variability introduces uncertainty in the estimate, and account for the uncertainty with a confidence interval by: Using resamplin...
Teacher's field guide
What This Cluster Means
What Students Need to Do
- Students use the mean of a representative sample to estimate a population mean. They draw from that sample with replacement to see how much the estimate might vary, then use that spread to make an approximate 95% confidence interval. They compare this with repeated samples from a known population, where the means cluster around the population mean.
What Mastery Looks Like
- A student uses the sample mean as the estimate and finds the standard deviation of the resampled means. They give an approximate 95% interval by adding and subtracting twice that standard deviation. They explain that, with large enough samples, repeated-sample means are roughly bell-shaped and about 95% fall within two standard deviations of the population mean.
Common Misconceptions
- Students may draw without replacement, so every resample contains the same values. They may think resampled means center on the population mean rather than the observed sample mean. They may say there is a 95% chance that the fixed population mean lies in one particular interval.
How to Assess It
- For 30 randomly selected students, the mean lunch wait is 12 minutes and the standard deviation of resampled means is 1 minute. Find an approximate 95% confidence interval and say what it estimates.
Lesson moves
Ways to Teach It
Give pairs 30 sampled lunch wait times on slips; draw 30 with replacement 20 times, then plot means on a class dot plot.
Ask: Why do resampled means cluster near our sample mean, while means from repeated samples of a known population cluster near its mean?
Give teams 100 listed scores; repeatedly draw 30, then check whether 95% of means fall within two sampling standard deviations of the population mean.
Give students 30 randomly sampled cafeteria receipt totals; have them estimate average lunch spending and explain the 95% interval to a cafeteria manager.
Free download
Printable MT.PLUS.DATA.INF.2 Worksheet
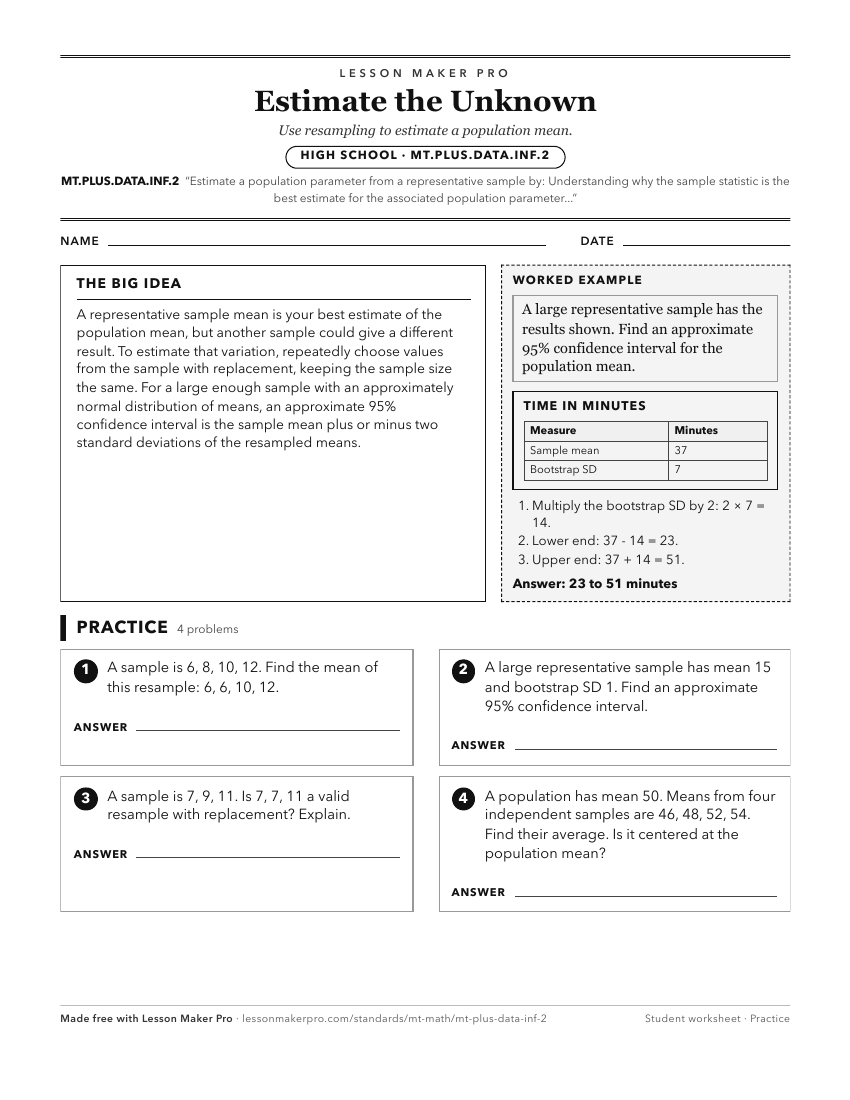
A ready-to-print activity worksheet aligned to MT.PLUS.DATA.INF.2, with an answer key for the teacher on its own page. No account needed.
PDF, US Letter, prints cleanly in black and white.
Download the worksheetKeep exploring
Related Standards
- MT.PLUS.DATA.DES.3
Evaluate the effect of sample size on the expected variability in the sampling distribution of a sample statistic by: Simulating a sampling distribution of samp...
- MT.PLUS.DATA.DES.3.a
Simulating a sampling distribution of sample means from a population with a known distribution, observing the effect of the sample size on the variability, and
Turn this cluster into a lesson
Grade, subject, topic, and the complete cluster are prefilled. Create one free, no account needed.
Also for this cluster:Make a WorksheetMake a QuizMake a Sub Lesson