Montana Math MT.PLUS.DATA.INF.2.a
The Standard
- MT.PLUS.DATA.INF.2
- Estimate a population parameter from a representative sample by: Understanding why the sample statistic is the best estimate for the associated population parameter, Understanding that sampling variability introduces uncertainty in the estimate, and account for the uncertainty with a confidence interval by: Using resampling with replacement from an observed sample to produce a sampling distribution, Verifying that a sampling distribution is centered at the population mean and approximately normal if the sample size is large enough, Verifying that 95% of sample means are within two standard deviations of the sampling distribution from the population mean, and Creating and interpreting a 95% confidence interval based on an observed mean from a sampling distribution.
Estimate a population parameter from a representative sample by: Understanding why the sample statistic is the best estimate for the associated population parameter,
2026 Montana Mathematics Content Standards · Data Reasoning
Teacher's field guide
What This Standard Means
What Students Need to Do
- Students calculate a mean or proportion from a representative sample. They use it to estimate the matching value for the whole population and explain why the estimate may not be exact.
What Mastery Looks Like
- If 18 of 30 randomly selected students bike to school, a student estimates that 60% of the school bikes. They explain that the sample gives the best available estimate, but a different random sample might give a different result.
Common Misconceptions
- Students may treat the sample result as the exact population value. They may use the count of 18 instead of the proportion of 18 out of 30. They may also assume a large, self-selected survey represents everyone.
How to Assess It
- A random sample of 40 students includes 14 who pack lunch. What percentage of the school would you estimate packs lunch, and why use that percentage?
Lesson moves
Ways to Teach It
Put 60 mixed-color counters in an opaque bag; draw 20 without looking, then estimate the red share of all 60.
A survey at one lunch table says 70% prefer pizza. Ask students to write why 70% may poorly estimate the whole school.
Hand pairs cards labeled 8 of 25, 14 of 40, and 23 of 50; race to estimate each population percentage.
Show a town poll where 48 of 80 randomly selected residents support a park; ask students to estimate townwide support.
Free download
Printable MT.PLUS.DATA.INF.2.a Worksheet
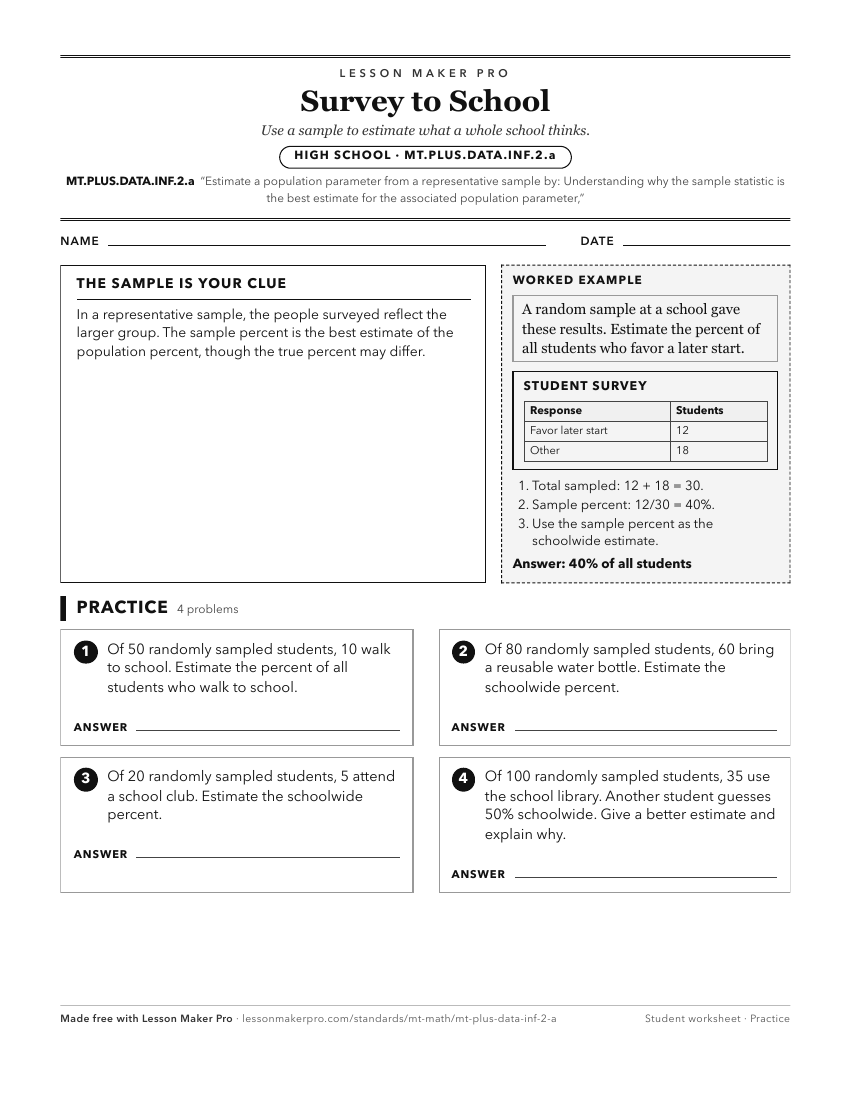
A ready-to-print activity worksheet aligned to MT.PLUS.DATA.INF.2.a, with an answer key for the teacher on its own page. No account needed.
PDF, US Letter, prints cleanly in black and white.
Download the worksheetKeep exploring
Related Standards
- MT.7.SP.1
Understand statistics can be used to gain information about a population by examining a representative sample of the population.
- MT.PLUS.DATA.INF.2
Estimate a population parameter from a representative sample by: Understanding why the sample statistic is the best estimate for the associated population param...
- MT.PLUS.DATA.INF.1
Distinguish between a statistic and a parameter and use statistical processes to make inferences about population parameters based on statistics from random sam...
- MT.PLUS.DATA.INF.2.b
Understanding that sampling variability introduces uncertainty in the estimate, and account for the uncertainty with a confidence interval by: Using resamplin...
Turn this exact standard into a lesson
Grade, subject, topic, and the complete standard are prefilled. Create one free, no account needed.
Also for this standard:Make a WorksheetMake a QuizMake a Sub Lesson