Montana Math MT.PLUS.DATA.INF.1
The Standard
Distinguish between a statistic and a parameter and use statistical processes to make inferences about population parameters based on statistics from random samples from that population.
2026 Montana Mathematics Content Standards · Data Reasoning
Teacher's field guide
What This Standard Means
What Students Need to Do
- Students tell apart a number calculated from a sample and a number that describes the whole population. They use a random sample to estimate a population value and explain why the estimate might be off.
What Mastery Looks Like
- Given a random sample, a student calculates its proportion and uses it to estimate the population proportion. They identify the sample result as a statistic and the unknown population value as a parameter.
Common Misconceptions
- Students may treat a sample percentage as the population's exact percentage. They may think two random samples must give the same result, or that volunteers represent everyone.
How to Assess It
- Exit ticket: A random sample of 40 of 800 students finds 26 take the bus. Identify the statistic and parameter, estimate the population bus rate, and explain why your estimate might differ from the true rate.
Lesson moves
Ways to Teach It
Place 50 mixed counters in an opaque bag; groups draw 10 with replacement five times, estimate the red share, then reveal the mix.
Ask: Two random samples report 30% and 42% biking to school. Which number is the population parameter? Explain your answer.
Sort two cards: '11 of 30 randomly sampled students bike' and '180 of 600 students bike'; label each percentage and identify which changes across samples.
Use a city poll reporting 62 of 100 randomly selected residents support a park; ask students to estimate citywide support and explain uncertainty.
Free download
Printable MT.PLUS.DATA.INF.1 Worksheet
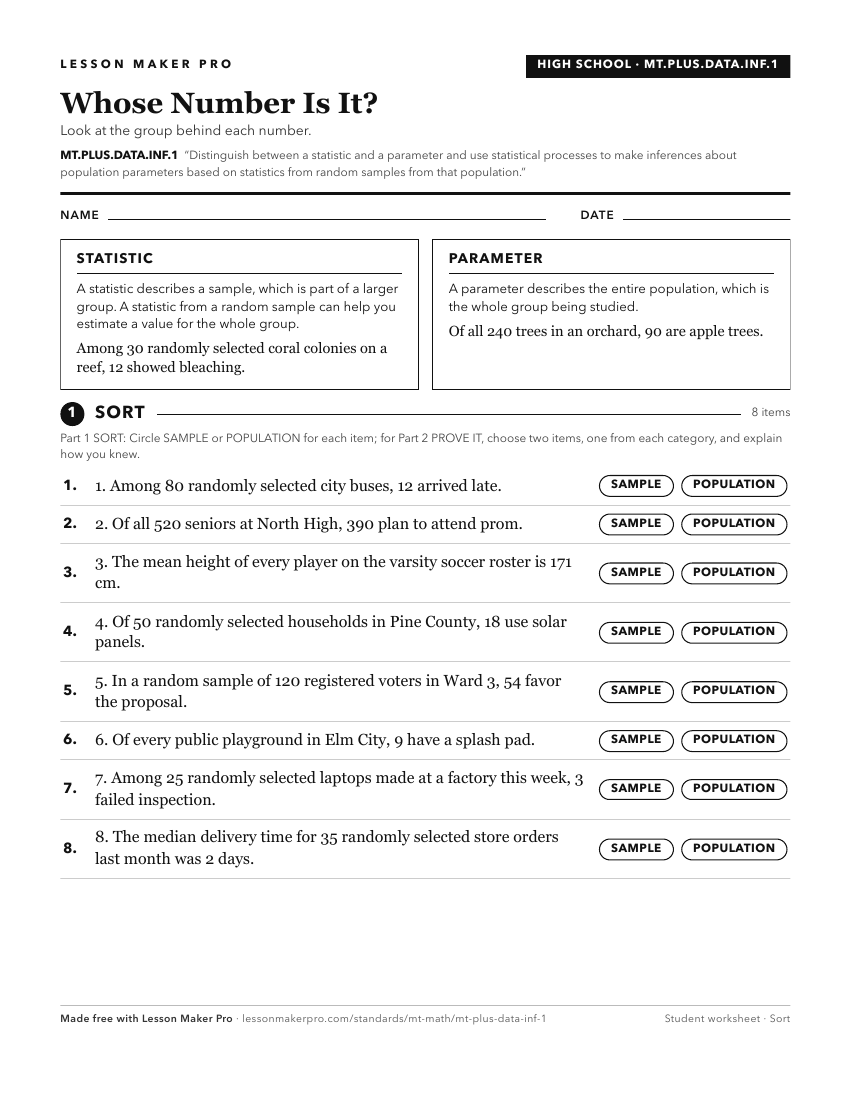
A ready-to-print activity worksheet aligned to MT.PLUS.DATA.INF.1, with an answer key for the teacher on its own page. No account needed.
PDF, US Letter, prints cleanly in black and white.
Download the worksheetKeep exploring
Related Standards
- MT.7.SP.4
Use measures of central tendency and measures of variability for numerical data from random samples to draw comparative inferences about two populations.
- MT.7.SP.1
Understand statistics can be used to gain information about a population by examining a representative sample of the population.
- MT.PLUS.DATA.INF.2
Estimate a population parameter from a representative sample by: Understanding why the sample statistic is the best estimate for the associated population param...
- MT.PLUS.DATA.INF.2.a
Understanding why the sample statistic is the best estimate for the associated population parameter,
Turn this exact standard into a lesson
Grade, subject, topic, and the complete standard are prefilled. Create one free, no account needed.
Also for this standard:Make a WorksheetMake a QuizMake a Sub Lesson