Montana Math MT.7.SP.4
The Standard
Use measures of central tendency and measures of variability for numerical data from random samples to draw comparative inferences about two populations.
2026 Montana Mathematics Content Standards
Teacher's field guide
What This Standard Means
What Students Need to Do
- Students use random samples from two groups to find a measure of center and a measure of spread for each. They use both measures to compare the larger groups without treating a sample as the whole group.
What Mastery Looks Like
- A student calculates the mean and mean absolute deviation for each sample. They explain whether typical values differ, which group varies more, and what the samples suggest about the larger groups.
Common Misconceptions
- Students may compare only the highest value or the mean and ignore spread. They may treat a handpicked group as a random sample or assume a sample result holds for every member of a group.
How to Assess It
- Random samples of bus wait times, in minutes, are Route A: 8, 8, 10, 10 and Route B: 8, 10, 12, 14. Find each mean and mean absolute deviation, then write one comparison.
Lesson moves
Ways to Teach It
Put numbered wait-time slips in separate Route A and Route B cups; pairs draw four from each, then compare means and mean absolute deviations.
Post sampled bus waits of 9, 9, 11, 11 and 6, 6, 14, 14; ask which route is more predictable and why.
Hand pairs four sample cards and eight statistic cards; have them match each sample to its mean and mean absolute deviation.
Compare randomly sampled battery runtimes: Brand A, 8, 9, 9, 10 hours; Brand B, 6, 8, 10, 12 hours; recommend one brand.
Free download
Printable MT.7.SP.4 Worksheet
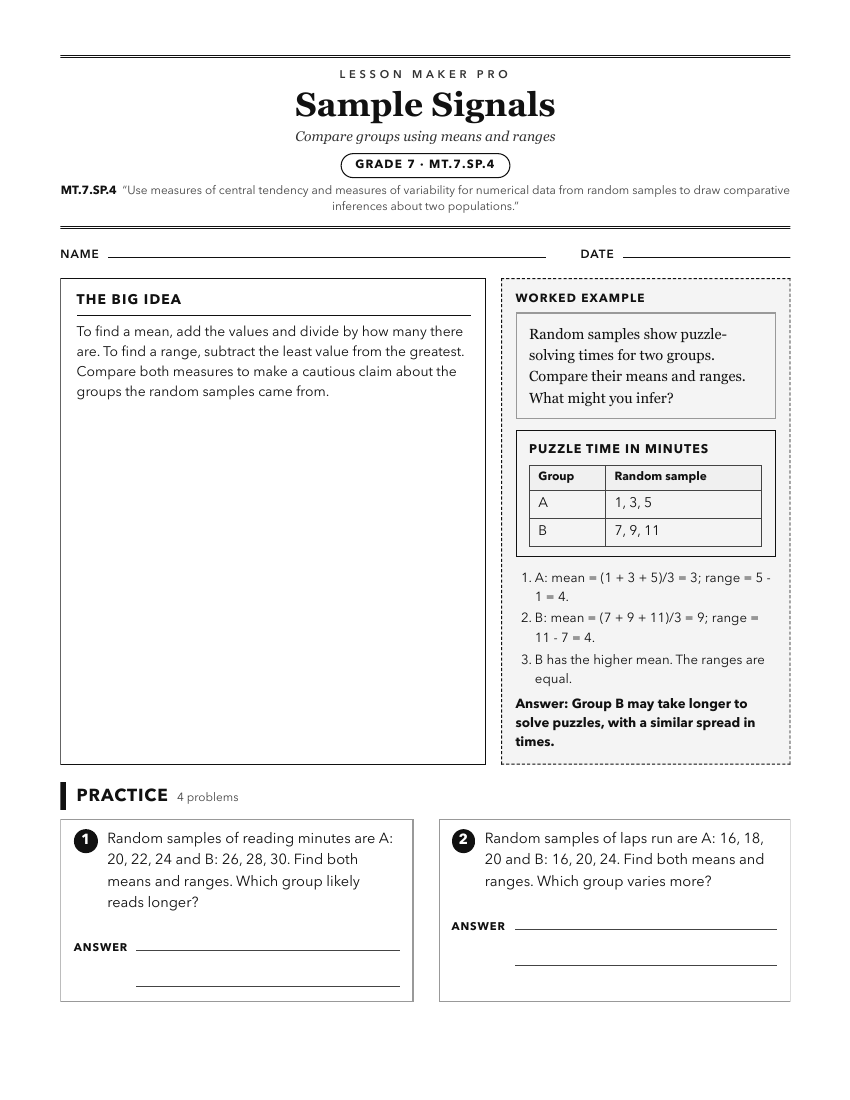
A ready-to-print activity worksheet aligned to MT.7.SP.4, with an answer key for the teacher on its own page. No account needed.
PDF, US Letter, prints cleanly in black and white.
Download the worksheetKeep exploring
Related Standards
- MT.7.SP.2
Use data from a random sample to draw inferences about a population with an unknown characteristic of interest and generate or simulate multiple samples of the ...
- MT.7.SP.3
Visually analyze two data distributions to compare measures of central tendency and variability.
- MT.6.SP.5
Characterize numerical data sets from a sample in relation to their context, such as by: Reporting the number of observations, Describing the nature of the attr...
Turn this exact standard into a lesson
Grade, subject, topic, and the complete standard are prefilled. Create one free, no account needed.
Also for this standard:Make a WorksheetMake a QuizMake a Sub Lesson