Montana Math MT.7.SP.3
The Standard
Visually analyze two data distributions to compare measures of central tendency and variability.
2026 Montana Mathematics Content Standards
Teacher's field guide
What This Standard Means
What Students Need to Do
- Students compare two data plots to see which group has a higher typical value and which is more spread out. They use medians and ranges to support what they see.
What Mastery Looks Like
- A student finds the median and range for each group and uses them to make a clear comparison. They can explain why two groups with the same median may have different spreads.
Common Misconceptions
- Students may treat the tallest stack of dots as the median or mistake the largest value for the range. They may say two groups are alike because their medians match, even when one group is much more spread out.
How to Assess It
- Exit ticket: Draw dot plots for A (2, 4, 6, 8, 10) and B (7, 7, 8, 9, 9). Give each median and range, then name the group with the higher center and the group with the wider spread.
Lesson moves
Ways to Teach It
Give groups two sets of numbered sticky notes, (2, 4, 6, 8, 10) and (5, 5, 6, 7, 7), to build side-by-side dot plots.
Ask students why the sticky-note plots have the same median but different spreads, using one value from each plot as evidence.
Deal dot-plot cards showing (1, 2, 3), (1, 2, 9), (5, 6, 7), and (5, 6, 13); students match equal medians and compare ranges.
Plot daily highs for Town A (60, 62, 65, 68, 70) and Town B (64, 65, 66, 66, 67); choose the warmer, steadier picnic spot.
Free download
Printable MT.7.SP.3 Worksheet
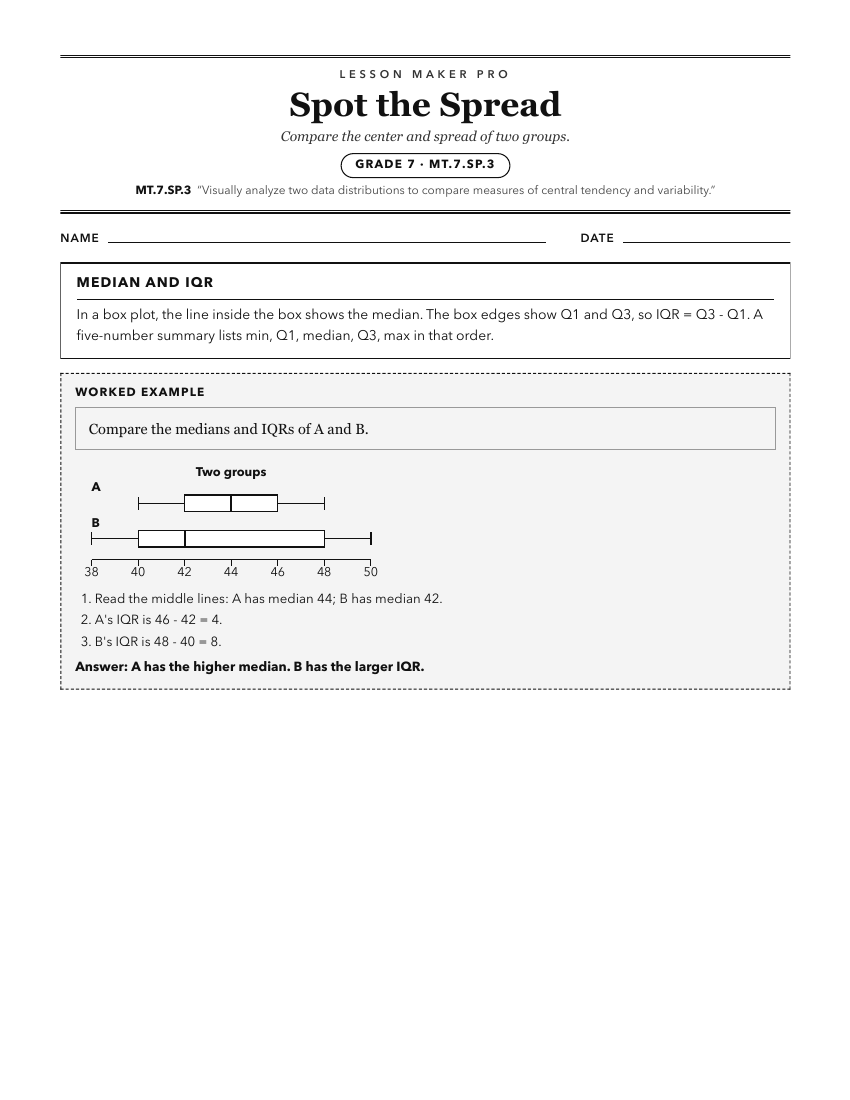
A ready-to-print activity worksheet aligned to MT.7.SP.3, with an answer key for the teacher on its own page. No account needed.
PDF, US Letter, prints cleanly in black and white.
Download the worksheetKeep exploring
Related Standards
- MT.7.SP.4
Use measures of central tendency and measures of variability for numerical data from random samples to draw comparative inferences about two populations.
- MT.6.SP.5
Characterize numerical data sets from a sample in relation to their context, such as by: Reporting the number of observations, Describing the nature of the attr...
Turn this exact standard into a lesson
Grade, subject, topic, and the complete standard are prefilled. Create one free, no account needed.
Also for this standard:Make a WorksheetMake a QuizMake a Sub Lesson