Montana Math MT.6.SP.5
The Standard
Characterize numerical data sets from a sample in relation to their context, such as by: Reporting the number of observations, Describing the nature of the attribute under investigation, including how it was measured and its units of measurement, and Finding quantitative measures of central tendency (mode, median, and/or mean) and variability (interquartile range and/or mean absolute deviation), for numerical data sets and relating the choice of measures of central tendency and variability to the shape of the data distribution and the context in which the data were gathered.
2026 Montana Mathematics Content Standards
Teacher's field guide
What This Standard Means
What Students Need to Do
- Students describe what was measured in a sample, how it was measured, the units, and the number of observations. They find a mean, median, or mode and describe spread using IQR or mean absolute deviation. They choose measures that fit the data.
What Mastery Looks Like
- Given a dot plot of trip times, a student reports the number of trips and the units, then calculates a center and a spread correctly. They choose median and IQR when one long trip pulls the mean up, and explain why.
Common Misconceptions
- Students may count distinct values instead of all observations or leave units off their answers. They may confuse the full range with IQR or use the mean without noticing an unusually high value.
How to Assess It
- Give students these trip times in minutes: 2, 3, 4, 5, 6, 7, 22. Ask for the number of trips, the median, the IQR, and one reason those measures fit the data.
Lesson moves
Ways to Teach It
Have pairs measure ten classmates' hand spans in centimeters, make a dot plot, and mark the median.
Show trip times of 2, 3, 4, 5, 6, 7, and 22 minutes; ask why median describes a typical trip better than mean.
Give teams cards of eight labeled measurements; award points for the correct median, IQR, and units on each card.
Print the past ten daily high temperatures for your town from a weather site; calculate mean and mean absolute deviation in degrees.
Free download
Printable MT.6.SP.5 Worksheet
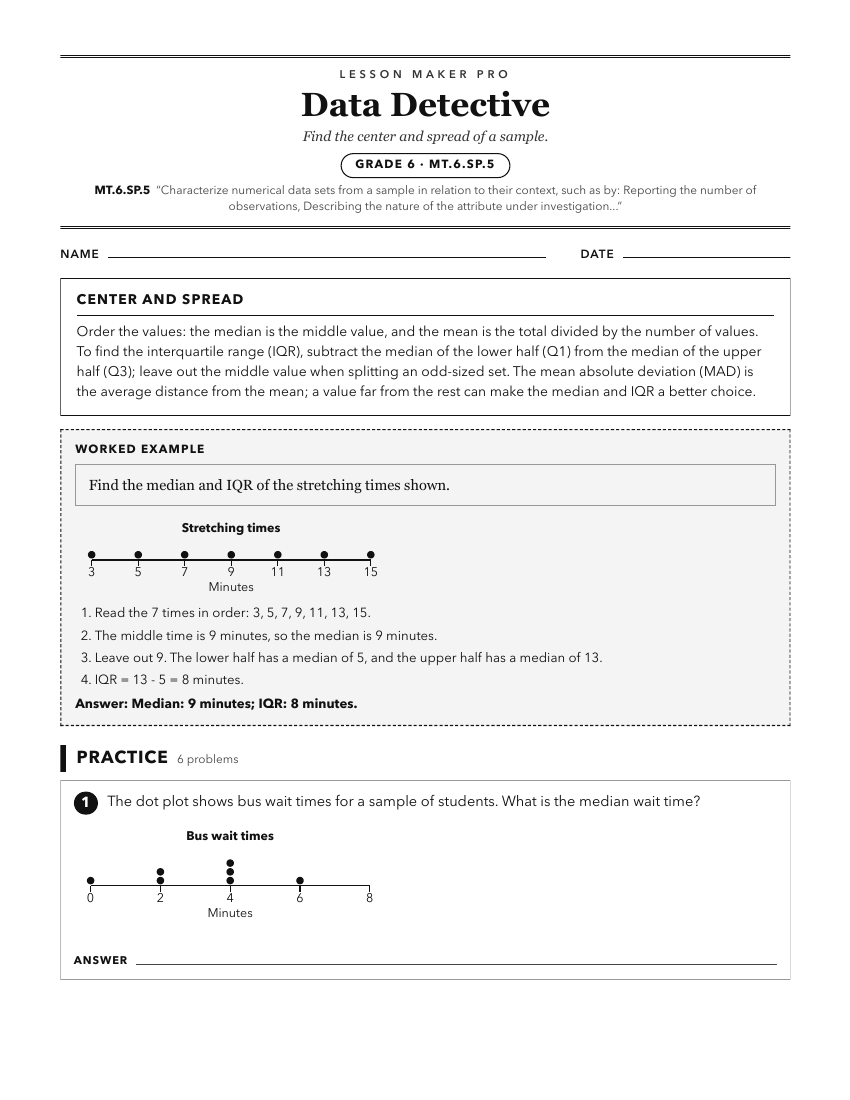
A ready-to-print activity worksheet aligned to MT.6.SP.5, with an answer key for the teacher on its own page. No account needed.
PDF, US Letter, prints cleanly in black and white.
Download the worksheetKeep exploring
Related Standards
- MT.7.SP.4
Use measures of central tendency and measures of variability for numerical data from random samples to draw comparative inferences about two populations.
- MT.1.MD.5
Organize, represent, and interpret data with up to three categories by: Asking and answering questions about the total number of data points, Identifying how ma...
- MT.6.SP.4
Display numerical data in plots on a number line, including dot plots, histograms, and box plots, and describe any overall pattern and any striking deviations f...
Turn this exact standard into a lesson
Grade, subject, topic, and the complete standard are prefilled. Create one free, no account needed.
Also for this standard:Make a WorksheetMake a QuizMake a Sub Lesson