Montana Math MT.6.SP.4
The Standard
Display numerical data in plots on a number line, including dot plots, histograms, and box plots, and describe any overall pattern and any striking deviations from the overall pattern with reference to the context from which the data were gathered.
2026 Montana Mathematics Content Standards
Teacher's field guide
What This Standard Means
What Students Need to Do
- Students make dot plots, histograms, and box plots from numerical data. They describe where values cluster, how spread out they are, and which values stand apart, using what the numbers measure.
What Mastery Looks Like
- A student places values correctly on a dot plot, uses equal-width intervals in a histogram, and marks the median and quartiles on a box plot. They describe a pattern or unusual value in the data's context.
Common Misconceptions
- Students may leave gaps between histogram bars or use intervals of different widths. They may think a box shows the full range or call a value unusual without comparing it with the others.
How to Assess It
- Exit ticket: Bus ride times were 5, 6, 7, 7, 8, 8, 9, 9, 10, 11, and 28 minutes. Draw a dot plot, then write one sentence about the usual ride time and the unusual one.
Lesson moves
Ways to Teach It
Hand pairs paper slips with bus ride times and have them stack the slips above a taped floor number line.
Show a reading-minutes histogram with most days at 10 to 30 minutes and one at 90; ask what the 90-minute day might represent.
Give teams a box plot and four five-number-summary cards; have them match the plot to a card and explain their choice.
Use 30 days of local high temperatures from a weather site to make a histogram and identify any unusually warm days.
Free download
Printable MT.6.SP.4 Worksheet
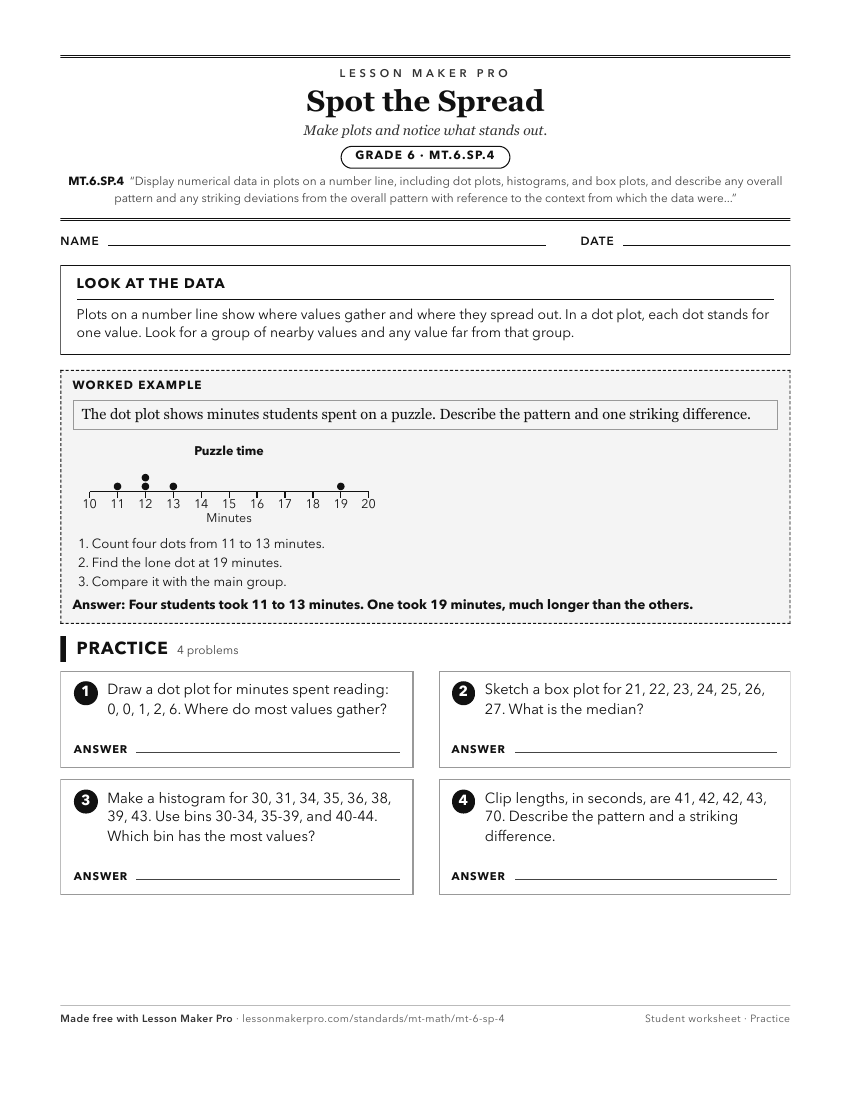
A ready-to-print activity worksheet aligned to MT.6.SP.4, with an answer key for the teacher on its own page. No account needed.
PDF, US Letter, prints cleanly in black and white.
Download the worksheetKeep exploring
Related Standards
- MT.4.MD.4
Make a line plot to display a data set of measurements in fractions of a unit and solve problems involving addition and subtraction of fractions by using inform...
- MT.1.MD.5
Organize, represent, and interpret data with up to three categories by: Asking and answering questions about the total number of data points, Identifying how ma...
- MT.6.SP.5
Characterize numerical data sets from a sample in relation to their context, such as by: Reporting the number of observations, Describing the nature of the attr...
- MT.5.MD.2
Make a line plot to display a data set of measurements in fractions of a unit and use operations on fractions to solve problems involving information presented ...
Turn this exact standard into a lesson
Grade, subject, topic, and the complete standard are prefilled. Create one free, no account needed.
Also for this standard:Make a WorksheetMake a QuizMake a Sub Lesson