Montana Math MT.7.SP.1
The Standard
Understand statistics can be used to gain information about a population by examining a representative sample of the population.
2026 Montana Mathematics Content Standards
Teacher's field guide
What This Standard Means
What Students Need to Do
- Students identify the group they want to learn about, then choose a smaller group that reflects it. They explain why asking only one kind of person can give misleading results.
What Mastery Looks Like
- A student can explain why drawing names from a school roster gives a better picture of schoolwide lunch preferences than asking only friends. They can say which group the results might describe.
Common Misconceptions
- Students may think a large sample is fair even if everyone surveyed comes from one class. They may treat a sample result as an exact count for the whole school.
How to Assess It
- Exit ticket: To learn what all students think of school lunch choices, would you survey 40 cafeteria customers or 40 names drawn from the school roster? Explain your choice.
Lesson moves
Ways to Teach It
Draw five names from a cup for an apple-or-orange preference poll, then compare their answers with a whole-class tally.
Ask, 'Would asking only your friends tell us what all seventh graders want for lunch?' Have students write one reason.
Give pairs three sample cards for a schoolwide lunch poll: friends, one class, and names drawn from the school roster; have them rank the cards.
Show a mock town park survey of only park visitors; ask whether the town can use it to plan for all residents.
Free download
Printable MT.7.SP.1 Worksheet
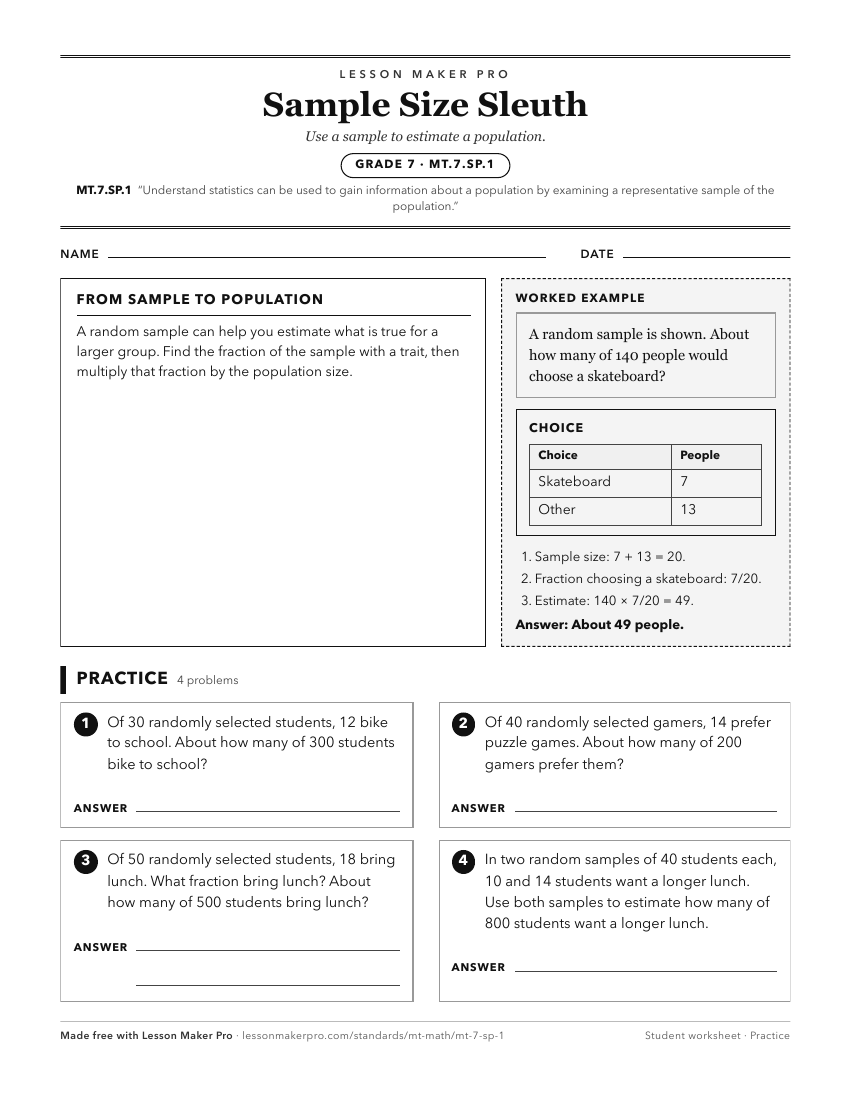
A ready-to-print activity worksheet aligned to MT.7.SP.1, with an answer key for the teacher on its own page. No account needed.
PDF, US Letter, prints cleanly in black and white.
Download the worksheetKeep exploring
Related Standards
- MT.7.SP.2
Use data from a random sample to draw inferences about a population with an unknown characteristic of interest and generate or simulate multiple samples of the ...
- MT.7.SP.4
Use measures of central tendency and measures of variability for numerical data from random samples to draw comparative inferences about two populations.
- MT.6.SP.2
Understand that a set of data collected to answer a statistical question has a distribution that can be described by its center, spread, and overall shape. This...
Turn this exact standard into a lesson
Grade, subject, topic, and the complete standard are prefilled. Create one free, no account needed.
Also for this standard:Make a WorksheetMake a QuizMake a Sub Lesson