Montana Math MT.PLUS.DATA.DES.3
Standard Cluster
Evaluate the effect of sample size on the expected variability in the sampling distribution of a sample statistic by: Simulating a sampling distribution of sample means from a population with a known distribution, observing the effect of the sample size on the variability, and Demonstrating that the standard deviation of each simulated sampling distribution is the known standard deviation of the population divided by the square root of the sample size.
2026 Montana Mathematics Content Standards · Data Reasoning
Cluster contents
Standards in This Cluster
MT.PLUS.DATA.DES.3 is a cluster heading. These are the individual standards under it.
- MT.PLUS.DATA.DES.3.a
Simulating a sampling distribution of sample means from a population with a known distribution, observing the effect of the sample size on the variability, and
- MT.PLUS.DATA.DES.3.b
Demonstrating that the standard deviation of each simulated sampling distribution is the known standard deviation of the population divided by the square root o...
Teacher's field guide
What This Cluster Means
What Students Need to Do
- Students draw many random samples from a population with a known standard deviation. They make a distribution of sample means for two sample sizes. They compare its standard deviation with the population standard deviation divided by the square root of the sample size.
What Mastery Looks Like
- With a population standard deviation of 5, students predict a standard deviation of 2.5 for means from samples of 4 and 1.25 for means from samples of 16. They calculate the standard deviations of their simulated sample means and explain why the results are close, but not exact.
Common Misconceptions
- Students may calculate the standard deviation of all sampled values instead of the standard deviation of the sample means. Some think larger samples change the population's spread, or that a simulation must match the predicted value exactly.
How to Assess It
- Exit ticket: A population has a standard deviation of 12. Predict the standard deviation of sample means for samples of 9 and 36, then explain why simulated results might differ slightly.
Lesson moves
Ways to Teach It
Assign heads 0 and tails 10; have pairs take repeated samples of 4 or 16 flips and post their means on class dot plots.
Ask: Why do 16-flip means cluster closer to 5 than 4-flip means when both come from the same coin?
In a spreadsheet, simulate 200 samples each of 4 and 16 coin flips coded 0 or 10; compare sample-mean SDs with 2.5 and 1.25.
Given cafeteria wait times with population SD 12 minutes, calculate the expected spread of sample means for samples of 9 and 36 students.
Free download
Printable MT.PLUS.DATA.DES.3 Worksheet
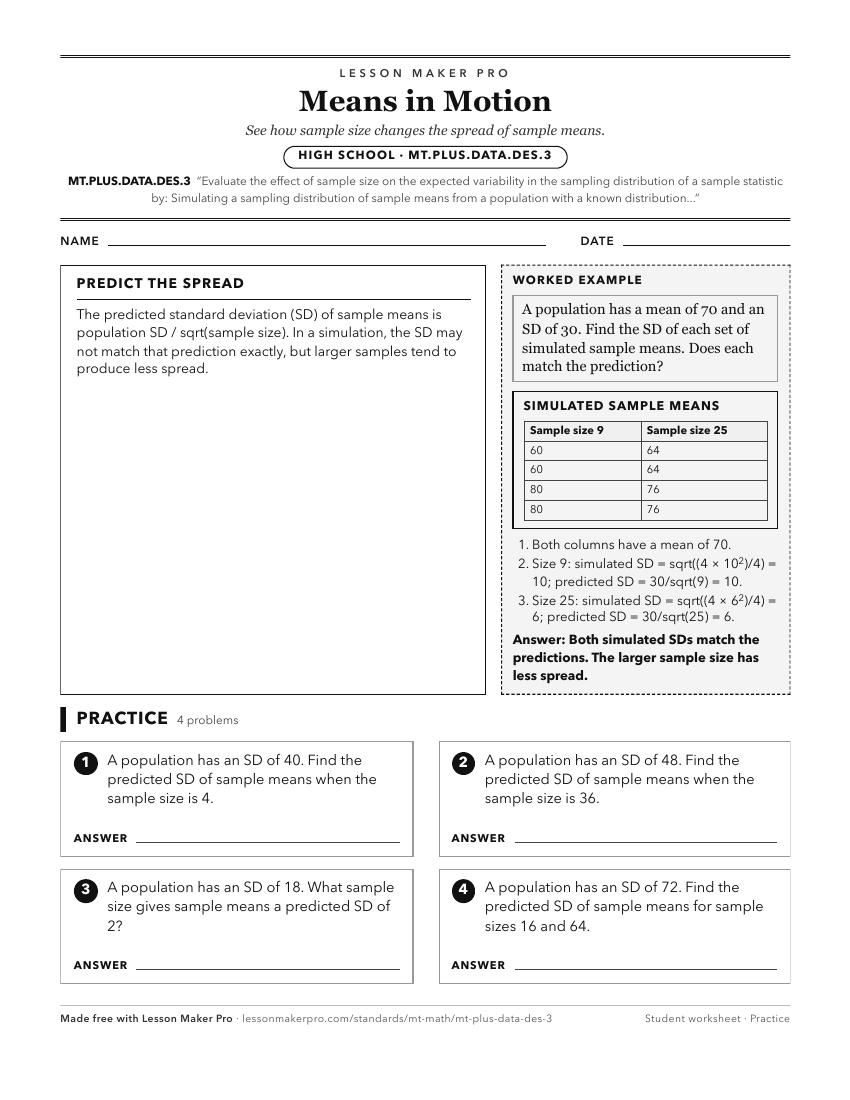
A ready-to-print activity worksheet aligned to MT.PLUS.DATA.DES.3, with an answer key for the teacher on its own page. No account needed.
PDF, US Letter, prints cleanly in black and white.
Download the worksheetKeep exploring
Related Standards
- MT.PLUS.DATA.INF.2
Estimate a population parameter from a representative sample by: Understanding why the sample statistic is the best estimate for the associated population param...
- MT.PLUS.DATA.INF.2.b
Understanding that sampling variability introduces uncertainty in the estimate, and account for the uncertainty with a confidence interval by: Using resamplin...
Turn this cluster into a lesson
Grade, subject, topic, and the complete cluster are prefilled. Create one free, no account needed.
Also for this cluster:Make a WorksheetMake a QuizMake a Sub Lesson