Montana Math MT.CORE.DATA.INT.3
The Standard
Understand that standard deviation measures the variability of a data distribution, and calculate standard deviation using technology.
2026 Montana Mathematics Content Standards · Data Reasoning and Probability
Teacher's field guide
What This Standard Means
What Students Need to Do
- Students describe how spread out data values are from the mean. They use a calculator or spreadsheet to find standard deviation and compare two data sets.
What Mastery Looks Like
- Students enter data correctly and read the standard deviation given by the tool. They can explain why a larger standard deviation means more spread when the data use the same units.
Common Misconceptions
- Students may think a higher mean always means greater spread. They may confuse standard deviation with the range or use a sample calculation when the data list is the whole group.
How to Assess It
- Enter 4, 5, 6 and 1, 5, 9 in two spreadsheet columns. Use STDEV.P on each column, then name the more variable set and explain your choice.
Lesson moves
Ways to Teach It
Place sticky notes at 4, 5, 6 and 1, 5, 9 on two floor number lines, then compare spread before checking STDEV.P.
Ask: Two classes average 70 on a quiz, but their standard deviations are 3 and 15. Which class has more consistent scores?
Show pairs three five-number lists, have them rank the lists by spread, then check their rankings with STDEV.P.
Record five days of bus arrival delays for two routes, calculate each standard deviation, and choose the more reliable route.
Free download
Printable MT.CORE.DATA.INT.3 Worksheet
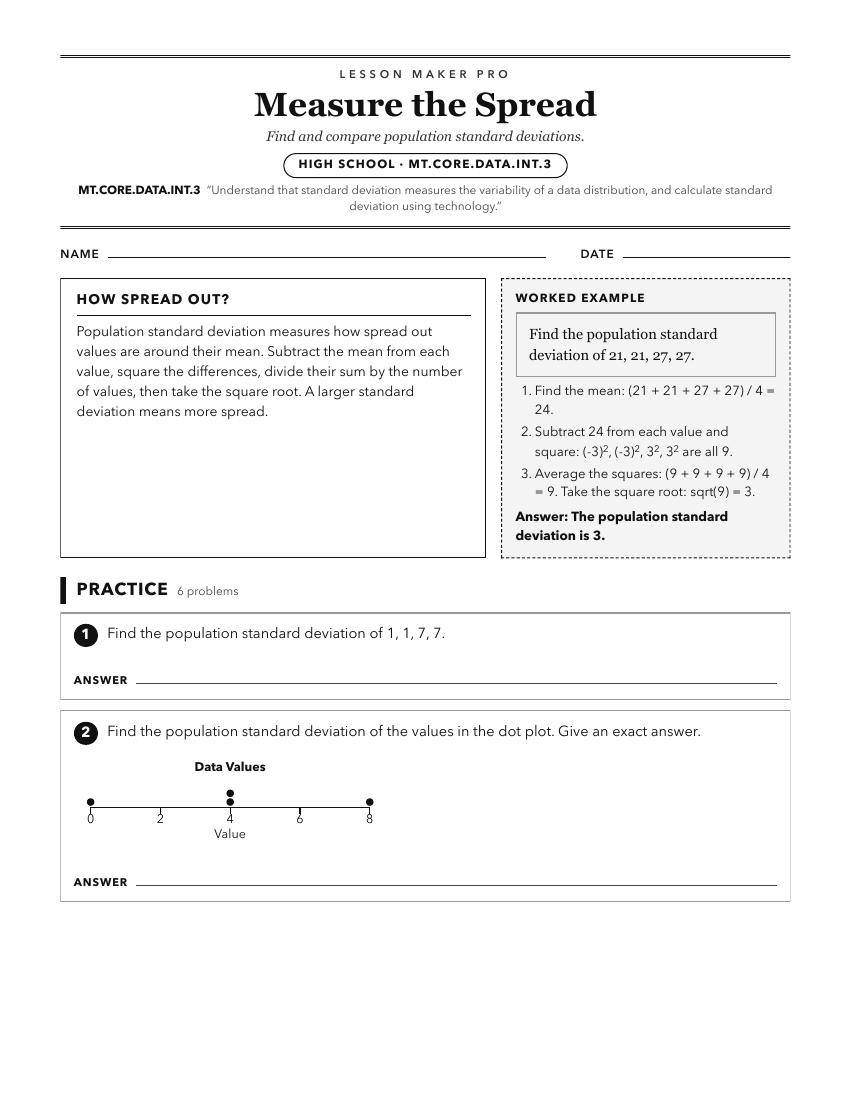
A ready-to-print activity worksheet aligned to MT.CORE.DATA.INT.3, with an answer key for the teacher on its own page. No account needed.
PDF, US Letter, prints cleanly in black and white.
Download the worksheetKeep exploring
Related Standards
- MT.PLUS.DATA.DES.3
Evaluate the effect of sample size on the expected variability in the sampling distribution of a sample statistic by: Simulating a sampling distribution of samp...
- MT.PLUS.DATA.NORM.2
Use technology to find the mean and standard deviation of a normally distributed data set and apply the empirical rule to estimate population percentages.
- MT.PLUS.DATA.DES.3.b
Demonstrating that the standard deviation of each simulated sampling distribution is the known standard deviation of the population divided by the square root o...
- MT.CORE.DATA.INT.4
Interpret differences in the shape, center, and spread of quantitative data distributions, in context, accounting for possible effects of outliers on measures o...
Turn this exact standard into a lesson
Grade, subject, topic, and the complete standard are prefilled. Create one free, no account needed.
Also for this standard:Make a WorksheetMake a QuizMake a Sub Lesson