Montana Math MT.CORE.DATA.INT.4
The Standard
Interpret differences in the shape, center, and spread of quantitative data distributions, in context, accounting for possible effects of outliers on measures of central tendency and variability.
2026 Montana Mathematics Content Standards · Data Reasoning and Probability
Teacher's field guide
What This Standard Means
What Students Need to Do
- Students compare plots of numerical data. They describe the shape, typical value, and spread in context. They explain how an unusual value can change those comparisons.
What Mastery Looks Like
- A student can identify which commute-time plot is more skewed and which has more spread. They use values from the plots to explain why the median better describes a typical commute when one trip takes much longer.
Common Misconceptions
- Students may call a plot symmetric because most values cluster together, even when a few high values form a long tail. They may assume an outlier changes the median as much as the mean, or overlook its effect on the range.
How to Assess It
- Exit ticket: Draw dot plots for bus rides of 5, 6, 7, 8, 9 minutes and 5, 6, 7, 8, 34 minutes. Calculate both means and medians, then compare shape and range and explain the effect of 34.
Lesson moves
Ways to Teach It
Give pairs cards marked 5, 6, 7, 8, 9; have them build a dot plot, replace 9 with 34, and recalculate mean and median.
Ask: Which better describes a typical bus ride, mean or median, when one ride took 34 minutes? Defend your choice using both plots.
Play Plot Match: post four histograms and four cards describing shape, center, and spread; teams match them and justify one match.
Compare cafeteria lines with waits of 3, 4, 5, 6, 22 minutes and 7, 8, 8, 9, 10 minutes; choose the steadier line.
Free download
Printable MT.CORE.DATA.INT.4 Worksheet
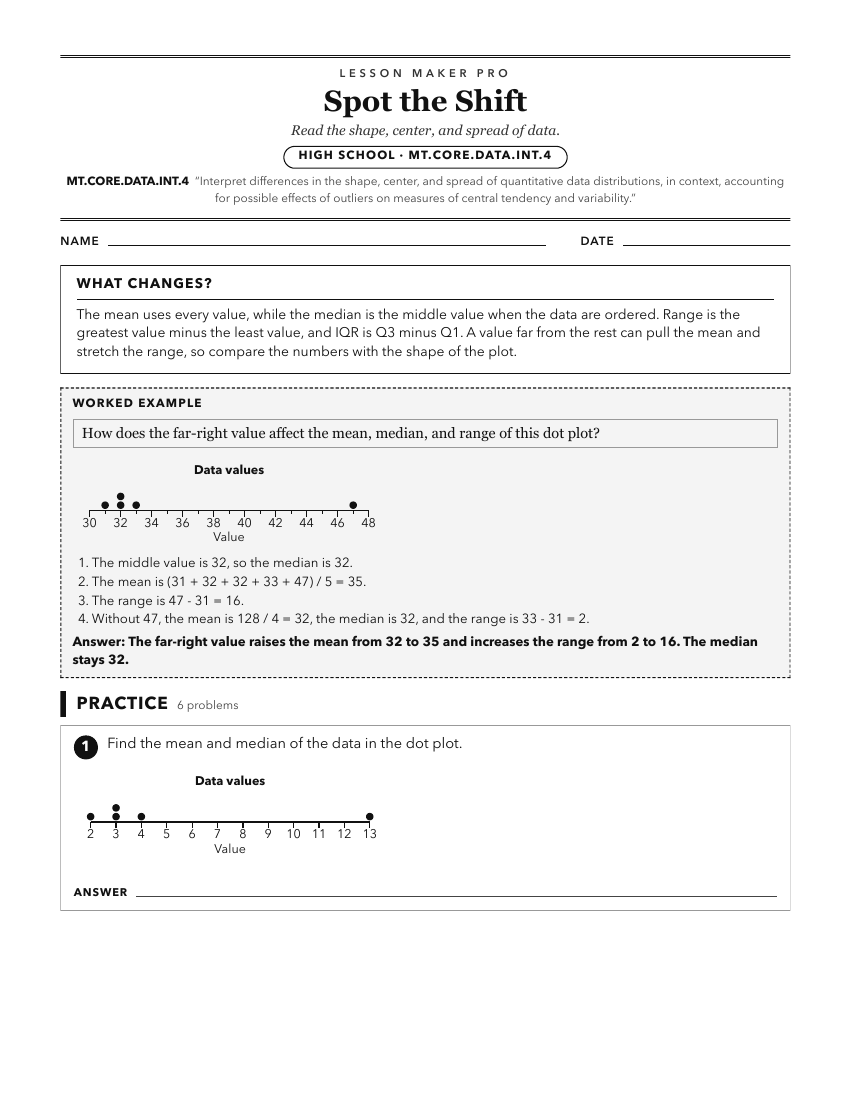
A ready-to-print activity worksheet aligned to MT.CORE.DATA.INT.4, with an answer key for the teacher on its own page. No account needed.
PDF, US Letter, prints cleanly in black and white.
Download the worksheetKeep exploring
Related Standards
- MT.7.SP.4
Use measures of central tendency and measures of variability for numerical data from random samples to draw comparative inferences about two populations.
- MT.7.SP.3
Visually analyze two data distributions to compare measures of central tendency and variability.
- MT.CORE.DATA.INT.5
Compare and contrast two or more quantitative data distributions, using shape, center, and spread in context. This standard should incorporate cultural context ...
- MT.6.SP.5
Characterize numerical data sets from a sample in relation to their context, such as by: Reporting the number of observations, Describing the nature of the attr...
Turn this exact standard into a lesson
Grade, subject, topic, and the complete standard are prefilled. Create one free, no account needed.
Also for this standard:Make a WorksheetMake a QuizMake a Sub Lesson