Montana Math MT.CORE.DATA.INT.5
The Standard
Compare and contrast two or more quantitative data distributions, using shape, center, and spread in context. This standard should incorporate cultural context relating to Montana Indigenous Peoples and local communities.
2026 Montana Mathematics Content Standards · Data Reasoning and Probability
Teacher's field guide
What This Standard Means
What Students Need to Do
- Students make dot plots for two sets of numerical data. They compare shape, typical value, and variation, then explain what the differences mean for the places the data describe.
What Mastery Looks Like
- A student can identify an outlier or a cluster and compare medians and ranges using the correct units. They can explain which place had more variable temperatures without treating one unusual day as typical.
Common Misconceptions
- Students may call one set warmer because it has the hottest single day, even when its median is lower. They may confuse a larger range with a higher typical value.
How to Assess It
- Exit ticket: These are made-up daily highs in °F for Browning (48, 50, 52, 54, 76) and Cut Bank (49, 51, 53, 55, 57). Draw dot plots and compare their shapes, medians, and ranges in context.
Lesson moves
Ways to Teach It
Give pairs printed daily highs from a public weather source for Browning, on the Blackfeet Reservation, and Cut Bank; build dot plots with sticky notes.
Ask: Which town had steadier temperatures for an outdoor gathering? Support your answer with both dot plots.
Play plot match: Display two dot plots and four description cards; teams match each plot to its median, range, and shape.
Plan an outdoor market for the Blackfeet Nation community in Browning using its temperature plot; explain how typical highs and variation affect the plan.
Free download
Printable MT.CORE.DATA.INT.5 Worksheet
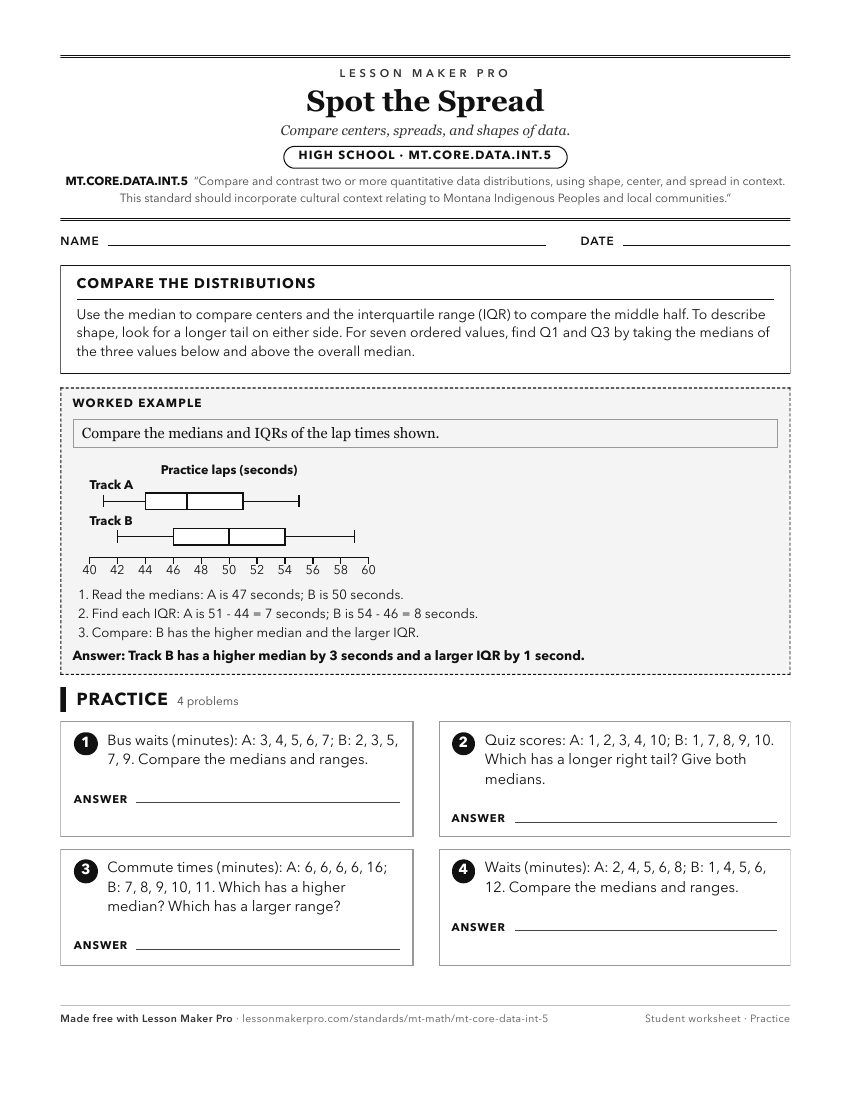
A ready-to-print activity worksheet aligned to MT.CORE.DATA.INT.5, with an answer key for the teacher on its own page. No account needed.
PDF, US Letter, prints cleanly in black and white.
Download the worksheetKeep exploring
Related Standards
- MT.2.MD.9
Generate measurement data and present the data in multiple ways. This standard should incorporate cultural context relating to Montana Indigenous Peoples and lo...
- MT.CORE.DATA.INT.6
Analyze the relationship between two quantitative data distributions in context that have a linear association. This standard should incorporate cultural contex...
- MT.2.MD.10
Organize, represent, and interpret data with up to four categories. This standard should incorporate cultural context relating to Montana Indigenous Peoples and...
- MT.6.SP.2
Understand that a set of data collected to answer a statistical question has a distribution that can be described by its center, spread, and overall shape. This...
Turn this exact standard into a lesson
Grade, subject, topic, and the complete standard are prefilled. Create one free, no account needed.
Also for this standard:Make a WorksheetMake a QuizMake a Sub Lesson