Montana Math MT.CORE.DATA.INT.6
Standard Cluster
Analyze the relationship between two quantitative data distributions in context that have a linear association. This standard should incorporate cultural context relating to Montana Indigenous Peoples and local communities by: Using technology strategically, represent two quantitative data distributions on scatter plots, Describing verbally how the variables are related, Using technology to find the least-squares regression line (line of best) fit for two quantitative variables, Understanding that the line of best fit minimizes the square of the residuals, and Understanding correlation as a measure of linear association and using technology, compute the correlation coefficient of a linear relationship.
2026 Montana Mathematics Content Standards · Data Reasoning and Probability
Cluster contents
Standards in This Cluster
MT.CORE.DATA.INT.6 is a cluster heading. These are the individual standards under it.
- MT.CORE.DATA.INT.6.a
Using technology strategically, represent two quantitative data distributions on scatter plots,
- MT.CORE.DATA.INT.6.b
Describing verbally how the variables are related,
- MT.CORE.DATA.INT.6.c
Using technology to find the least-squares regression line (line of best) fit for two quantitative variables,
- MT.CORE.DATA.INT.6.d
Understanding that the line of best fit minimizes the square of the residuals, and
- MT.CORE.DATA.INT.6.e
Understanding correlation as a measure of linear association and using technology, compute the correlation coefficient of a linear relationship.
Teacher's field guide
What This Cluster Means
What Students Need to Do
- Students use a spreadsheet to plot paired measurements as a scatterplot. They describe the linear pattern, find a regression line and correlation coefficient, and check how far points fall from the line.
What Mastery Looks Like
- They keep measurements paired and describe the direction and strength of the pattern. They interpret the fitted slope and correlation in context. They can show that the fitted line has a smaller sum of squared vertical residuals than another line.
Common Misconceptions
- Students sometimes pair readings from different dates, so each dot no longer represents one observation. They may treat a negative correlation as a weak relationship or assume correlation proves cause. Some think the fitted line minimizes horizontal gaps rather than squared vertical residuals.
How to Assess It
- Give eight same-day pairs of Flathead Lake water and nearby air temperatures in a spreadsheet. Ask for a scatterplot, fitted line, correlation coefficient, and one sentence describing the relationship and what the line minimizes.
Lesson moves
Ways to Teach It
Plot teacher-provided pairs of Flathead Lake water and nearby air temperatures with sticky notes on a wall grid, then check a spreadsheet scatterplot.
Ask: Does a strong correlation between air and lake temperatures mean air temperature alone controls lake temperature? Name one other factor.
In pairs, use a spreadsheet to compare two candidate lines by summing squared vertical residuals; award a point for finding the smaller total.
On a Flathead Lake map, locate the Confederated Salish and Kootenai Tribes reservation and explain one limit of a lake temperature prediction.
Free download
Printable MT.CORE.DATA.INT.6 Worksheet
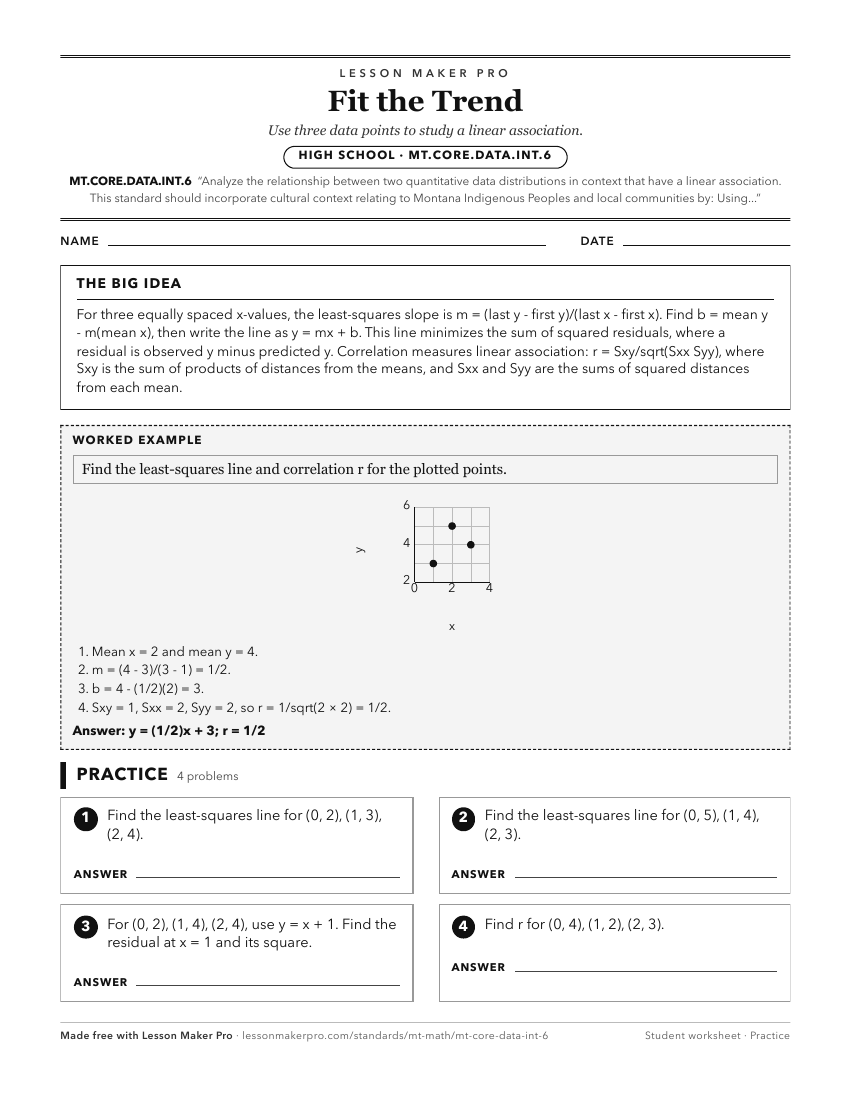
A ready-to-print activity worksheet aligned to MT.CORE.DATA.INT.6, with an answer key for the teacher on its own page. No account needed.
PDF, US Letter, prints cleanly in black and white.
Download the worksheetKeep exploring
Related Standards
- MT.CORE.DATA.INT.5
Compare and contrast two or more quantitative data distributions, using shape, center, and spread in context. This standard should incorporate cultural context ...
- MT.6.EE.8
Use variables to represent two quantities that change in relationship to one another, analyze the relationship between the dependent and independent variables u...
- MT.CORE.DATA.INT.7
Analyze the relationship between two categorical variables in context. This standard should incorporate cultural context relating to Montana Indigenous Peoples ...
- MT.6.SP.2
Understand that a set of data collected to answer a statistical question has a distribution that can be described by its center, spread, and overall shape. This...
Turn this cluster into a lesson
Grade, subject, topic, and the complete cluster are prefilled. Create one free, no account needed.
Also for this cluster:Make a WorksheetMake a QuizMake a Sub Lesson