Montana Math MT.CORE.DATA.INT.6.d
The Standard
- MT.CORE.DATA.INT.6
- Analyze the relationship between two quantitative data distributions in context that have a linear association. This standard should incorporate cultural context relating to Montana Indigenous Peoples and local communities by: Using technology strategically, represent two quantitative data distributions on scatter plots, Describing verbally how the variables are related, Using technology to find the least-squares regression line (line of best) fit for two quantitative variables, Understanding that the line of best fit minimizes the square of the residuals, and Understanding correlation as a measure of linear association and using technology, compute the correlation coefficient of a linear relationship.
Analyze the relationship between two quantitative data distributions in context that have a linear association. This standard should incorporate cultural context relating to Montana Indigenous Peoples and local communities by: Understanding that the line of best fit minimizes the square of the residuals, and
2026 Montana Mathematics Content Standards · Data Reasoning and Probability
Teacher's field guide
What This Standard Means
What Students Need to Do
- Students plot paired measurements and describe whether they show a roughly straight-line pattern. They calculate the difference between each measured value and a line’s prediction, then square and add those differences.
What Mastery Looks Like
- A student can choose the better of two lines by finding which has the smaller sum of squared residuals. They can use a fitted line to make a prediction and explain why a prediction beyond the measured range is less reliable.
Common Misconceptions
- Students may add residuals before squaring them, which lets positive and negative errors cancel. Some choose the line that passes through the most points without checking its overall errors. Others treat a trend as proof that one measurement caused the other.
How to Assess It
- For paired readings (1,3), (2,4), and (3,7), compare y=2x+1 with y=x+2. Ask students to show each squared residual, total them, and name the better fit.
Lesson moves
Ways to Teach It
Plot simulated upstream and downstream flows (1,2), (2,4), (3,5), (4,8) near the Flathead Reservation; compare squared residual sums for y=2x and y=x+1.
Read an excerpt from the Confederated Salish and Kootenai Tribes Natural Resources Department website; ask which streamflow claims the scatterplot supports.
Using the four flow pairs, teams race to rank y=2x, y=x+1, and y=1.5x+1 by their squared residual sums.
Find five matching daily readings from two USGS Flathead River gauges; plot them and discuss limits of predicting downstream flow.
Free download
Printable MT.CORE.DATA.INT.6.d Worksheet
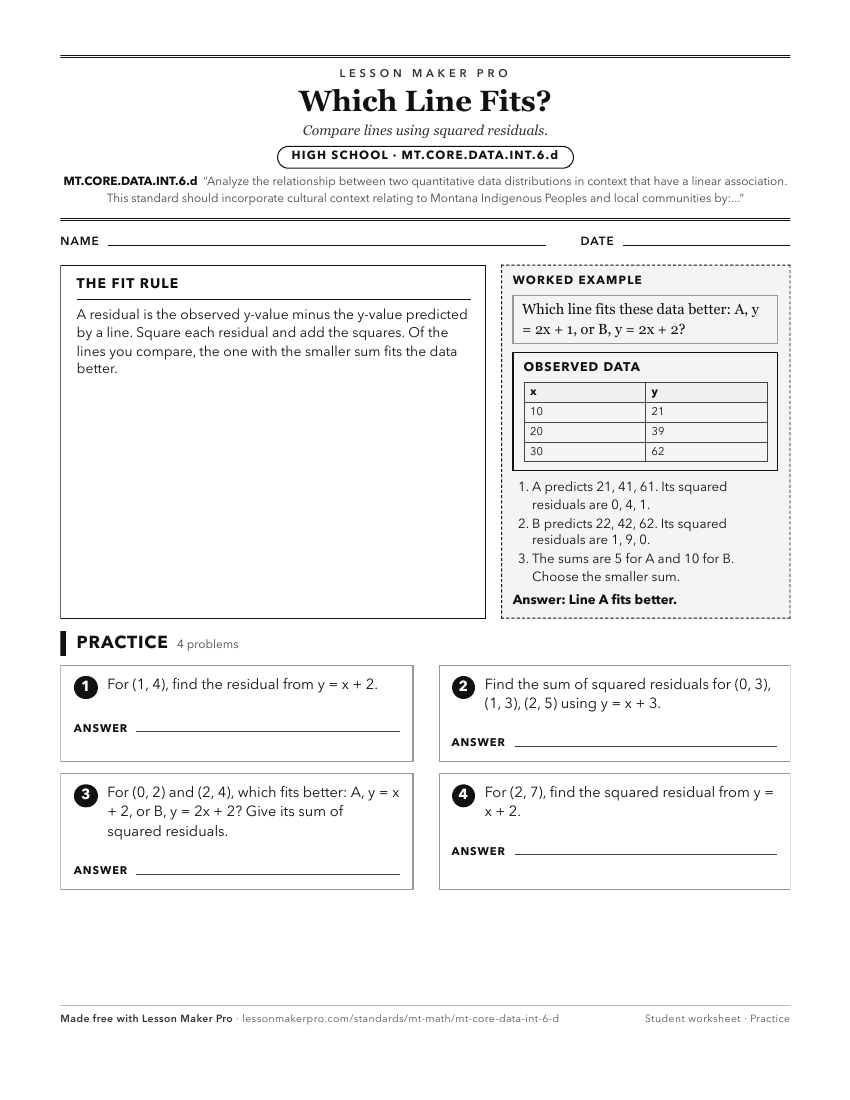
A ready-to-print activity worksheet aligned to MT.CORE.DATA.INT.6.d, with an answer key for the teacher on its own page. No account needed.
PDF, US Letter, prints cleanly in black and white.
Download the worksheetKeep exploring
Related Standards
- MT.CORE.ALG.MOD.1.a
Determining if a set of data is best modeled by a linear function, quadratic function, exponential function, or none, and explaining why, and
- MT.CORE.DATA.INT.6.c
Using technology to find the least-squares regression line (line of best) fit for two quantitative variables,
- MT.CORE.ALG.LIN.4.e
Understanding the relationship between standard form and the x- and y-intercepts.
Turn this exact standard into a lesson
Grade, subject, topic, and the complete standard are prefilled. Create one free, no account needed.
Also for this standard:Make a WorksheetMake a QuizMake a Sub Lesson