Montana Math MT.CORE.DATA.INT.6.b
The Standard
- MT.CORE.DATA.INT.6
- Analyze the relationship between two quantitative data distributions in context that have a linear association. This standard should incorporate cultural context relating to Montana Indigenous Peoples and local communities by: Using technology strategically, represent two quantitative data distributions on scatter plots, Describing verbally how the variables are related, Using technology to find the least-squares regression line (line of best) fit for two quantitative variables, Understanding that the line of best fit minimizes the square of the residuals, and Understanding correlation as a measure of linear association and using technology, compute the correlation coefficient of a linear relationship.
Analyze the relationship between two quantitative data distributions in context that have a linear association. This standard should incorporate cultural context relating to Montana Indigenous Peoples and local communities by: Describing verbally how the variables are related,
2026 Montana Mathematics Content Standards · Data Reasoning and Probability
Teacher's field guide
What This Standard Means
What Students Need to Do
- Students read or make scatterplots from paired measurements, such as miles and minutes for trips to Blackfeet Community College. They describe whether the points rise or fall, how closely they follow a line, and what the pattern means for the trips.
What Mastery Looks Like
- A student can explain that each point represents one trip with a distance and a travel time. Given two scatterplots, they can identify which has a tighter linear pattern and point to evidence on the graphs.
Common Misconceptions
- Some students read one point as two separate trips instead of two measurements for the same trip. Others think a steeper line always means a stronger pattern, or that trips of the same distance must take the same time.
How to Assess It
- Exit ticket: Sample trips to Blackfeet Community College have miles and minutes of (5,8), (10,16), (15,21), and (20,29). Describe the pattern and explain what (15,21) means.
Lesson moves
Ways to Teach It
On graph paper, plot sample miles and minutes for trips to Blackfeet Community College: (5,8), (10,16), (15,21), (20,29), (25,34), (30,43).
Ask: “Do these travel points form a tight upward line? What might explain a trip that falls far above it?”
Give teams three scatterplots and three written descriptions; have them match each description to a plot and defend one match.
Use a map to find distances and estimated drive times from six Browning-area starting points to Blackfeet Community College.
Free download
Printable MT.CORE.DATA.INT.6.b Worksheet
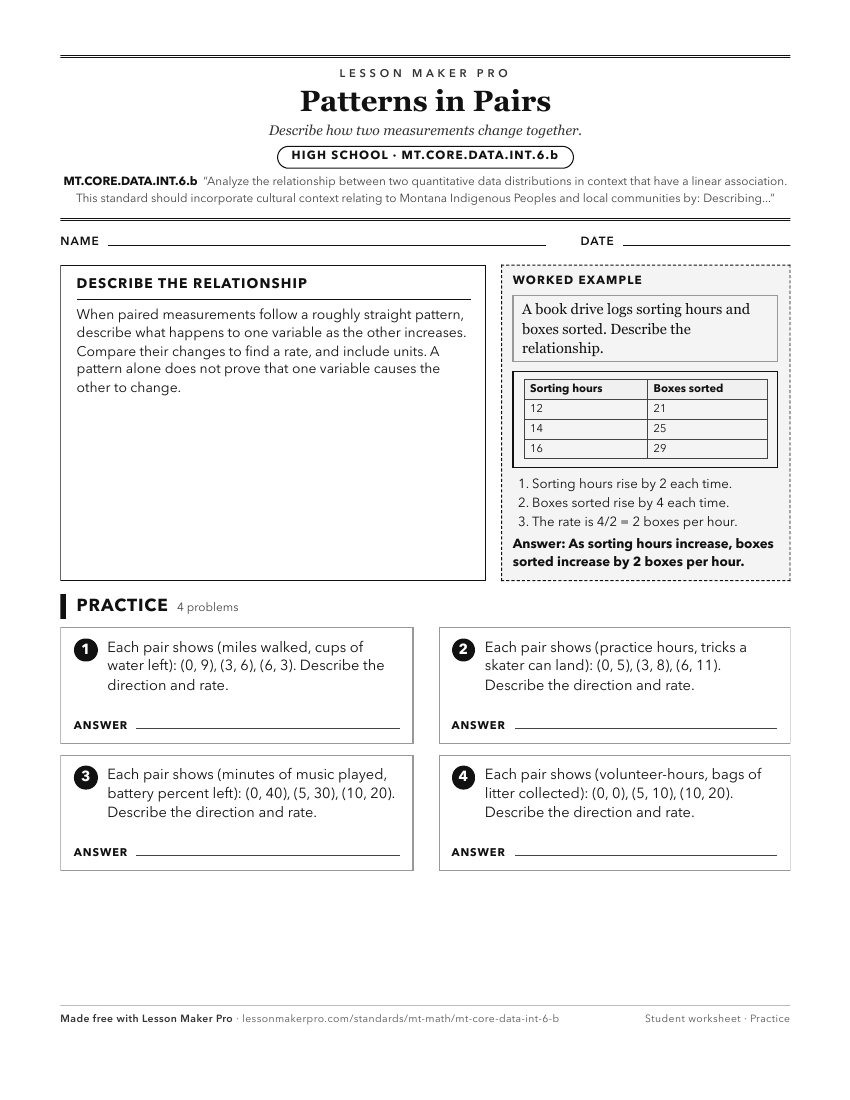
A ready-to-print activity worksheet aligned to MT.CORE.DATA.INT.6.b, with an answer key for the teacher on its own page. No account needed.
PDF, US Letter, prints cleanly in black and white.
Download the worksheetKeep exploring
Related Standards
- MT.7.EE.2
Understand that rewriting an expression in different forms in a problem in context can show how the quantities in it are related.
- MT.6.EE.8
Use variables to represent two quantities that change in relationship to one another, analyze the relationship between the dependent and independent variables u...
Turn this exact standard into a lesson
Grade, subject, topic, and the complete standard are prefilled. Create one free, no account needed.
Also for this standard:Make a WorksheetMake a QuizMake a Sub Lesson