Indiana Social Studies WG.3.5
The Standard
Illustrate and graph with precision the occurrence of earthquakes and tsunami and volcanic activity on Earth over a given period of time (at least several months) and draw conclusions concerning regions of tectonic instability. Identify early detection and prevention technologies.
2026 Indiana Academic Standards: K-12 Social Studies
Teacher's field guide
What This Standard Means
What Students Need to Do
- Students plot earthquakes, tsunami reports, and eruptions from several months of records on a map. They graph monthly counts, use clusters to locate unstable regions, and identify tools that warn people or reduce harm.
What Mastery Looks Like
- A student plots events at the correct coordinates and uses a clear legend and labeled graph axes. They use mapped events and monthly counts to support a claim about an unstable region. They explain that sensors provide warnings, while evacuation routes and stronger buildings reduce harm.
Common Misconceptions
- Students may plot a tsunami report at the earthquake epicenter instead of where the wave was observed. They may assume every offshore quake causes a tsunami or think sensors can stop earthquakes and eruptions.
How to Assess It
- Give students an eight-event table with dates, coordinates, and event types spanning four months, plus a blank map and graph. Ask them to plot two events, graph monthly counts by type, circle an unstable region, and name one warning tool and one safety measure.
Lesson moves
Ways to Teach It
Give pairs four months of event cards with dates and coordinates; have them place color-coded pins on a world map and tally monthly totals.
Show a four-month event map and bar graph; ask, 'Which region has the most events, and which two mapped events support your answer?'
Run a map-and-graph relay: teams add one dated event to a labeled map and its month's bar, then check another team's placement.
Use a coastal evacuation map and a tsunami buoy diagram; have students mark a safe route and explain how buoy readings support warnings.
Free download
Printable WG.3.5 Worksheet
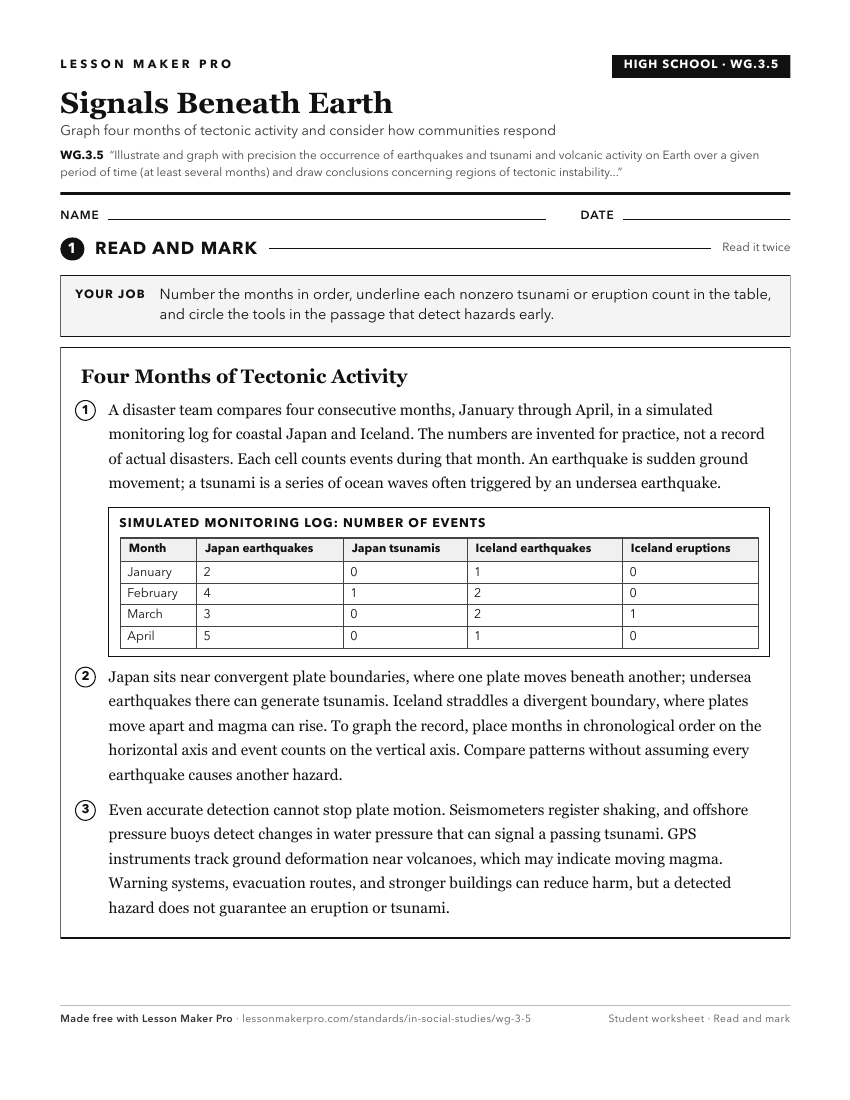
A ready-to-print activity worksheet aligned to WG.3.5, with an answer key for the teacher on its own page. No account needed.
PDF, US Letter, prints cleanly in black and white.
Download the worksheetKeep exploring
Related Standards
- 7.G.3
Use historical and modern maps to identify changes in Africa, Asia, and the Southwest Pacific over time, highlighting physical and human systems.
- WG.5.1
Map the occurrence and describe the effects of natural hazards throughout the world and explain ways to prepare for and respond to them.
- GHW.8.1
Use maps to show the location and distribution of Earth’s resources, and analyze how this distribution changes over time and affects trade among countries, regi...
- GHW.9.1
Use maps to identify regions in the world where particular natural disasters occur frequently, and analyze how the physical and human environments have been mod...
Turn this exact standard into a lesson
Grade, subject, topic, and the complete standard are prefilled. Create one free, no account needed.
Also for this standard:Make a WorksheetMake a QuizMake a Sub Lesson