Indiana Science HS-PSII-2.4
The Standard
Develop graphical and mathematical representations that describe the relationship among the volume, temperature, and number of molecules of an ideal gas in a closed system and the pressure exerted by the system and apply those representations to qualitatively and quantitatively describe how changing any of those variables affects the others.
Indiana Academic Standards for Science (2023) · Temperature and Thermal Energy Transfer
Teacher's field guide
What This Standard Means
What Students Need to Do
- Students graph how pressure changes when they change the volume or temperature of trapped gas. They use an equation to calculate a new pressure, volume, or temperature. They also compare sealed containers with different numbers of gas molecules.
What Mastery Looks Like
- Students draw a curved pressure-versus-volume graph at fixed temperature and a straight pressure-versus-Kelvin-temperature graph at fixed volume. They calculate changes using P₁V₁/T₁ = P₂V₂/T₂ for one sealed sample and explain why more molecules produce more pressure when volume and temperature stay fixed.
Common Misconceptions
- Students use Celsius instead of Kelvin in calculations. They may think pressure rises when volume rises, or treat one sealed sample as though molecules can enter or leave.
How to Assess It
- A sealed syringe holds air at 100 kPa, 300 K, and 20 mL. At 300 K, it is compressed to 10 mL. Ask students to calculate the new pressure and sketch a pressure-versus-volume graph.
Lesson moves
Ways to Teach It
Cap a syringe holding 20 mL of air, press its plunger to 10 mL, and have students describe the change in resistance.
Ask students to explain why warming a sealed, rigid jar raises pressure while warming a sealed balloon mostly increases its volume.
Give pairs of gas-state cards with pressure, volume, Kelvin temperature, and molecule count; have students match cards using PV/(NT).
Compare a bike tire's pressure before and after a cool night, then estimate the new pressure using Kelvin temperatures.
Free download
Printable HS-PSII-2.4 Worksheet
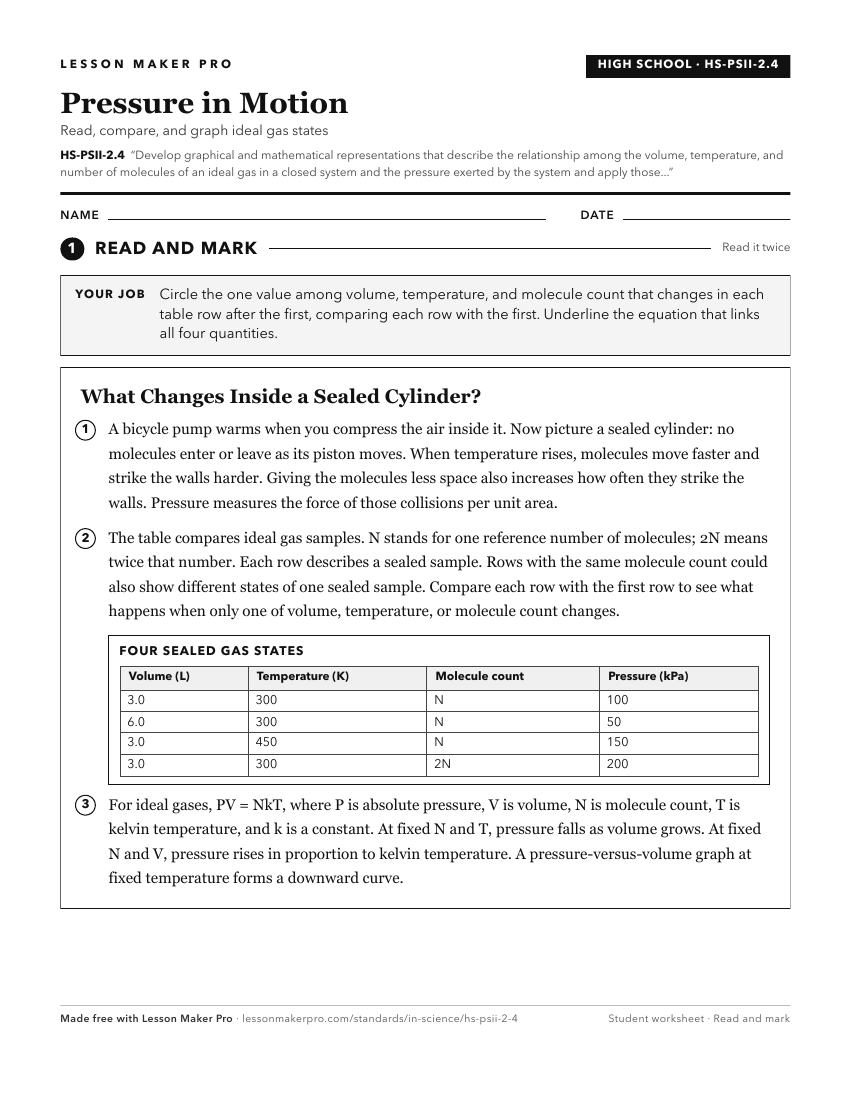
A ready-to-print activity worksheet aligned to HS-PSII-2.4, with an answer key for the teacher on its own page. No account needed.
PDF, US Letter, prints cleanly in black and white.
Download the worksheetKeep exploring
Related Standards
- HS-PSII-2.1
Develop graphical and mathematical representations that describe the relationship among the temperature, thermal energy, and thermal energy transfer (i.e., heat...
- HS-PSII-3.1
For a static, incompressible fluid, develop and apply graphical and mathematical representations that describe the relationship between the density and the pres...
- HS-PSII-2.5
Describe the slope of the graphical representation of pressure vs. the product of: the number of particles, temperature of the gas, and inverse of the volume of...
- HS-PSII-2.6
Using PV graphs, qualitatively and quantitatively determine how changes in the pressure, volume, or temperature of an ideal gas allow the gas to do work and cla...
Turn this exact standard into a lesson
Grade, subject, topic, and the complete standard are prefilled. Create one free, no account needed.
Also for this standard:Make a WorksheetMake a QuizMake a Sub Lesson