Indiana Science HS-PSII-2.5
The Standard
Describe the slope of the graphical representation of pressure vs. the product of: the number of particles, temperature of the gas, and inverse of the volume of the gas in terms of the ideal gas constant.
Indiana Academic Standards for Science (2023) · Temperature and Thermal Energy Transfer
Teacher's field guide
What This Standard Means
What Students Need to Do
- Students graph pressure against the amount of gas times its temperature in kelvins, divided by its volume. They find the slope from two points and relate it to the ideal gas constant.
What Mastery Looks Like
- A student can calculate rise over run and give units that match the axes. They identify the slope as R when gas amount is in moles, or R divided by Avogadro’s number when counting individual particles.
Common Misconceptions
- Students may use Celsius instead of kelvins or multiply by volume instead of dividing by it. Some reverse rise and run, or call the slope R even when the graph uses individual particles.
How to Assess It
- Exit ticket: A pressure versus nT/V graph has points (1 mol·K/L, 8.31 kPa) and (2 mol·K/L, 16.62 kPa). Find the slope, give its units, and name the constant.
Lesson moves
Ways to Teach It
Use a sealed syringe, pressure sensor, and supplied mole count to graph pressure against nT/V at three volumes.
Ask students to write why pressure belongs on the vertical axis if the slope is to equal R.
Give pairs graph cards with slopes of 8.31 and 0.831; have them calculate rise over run and match R.
Give absolute tire pressures of 321 kPa at 290 K and 332 kPa at 300 K; ask why nT/V increases.
Free download
Printable HS-PSII-2.5 Worksheet
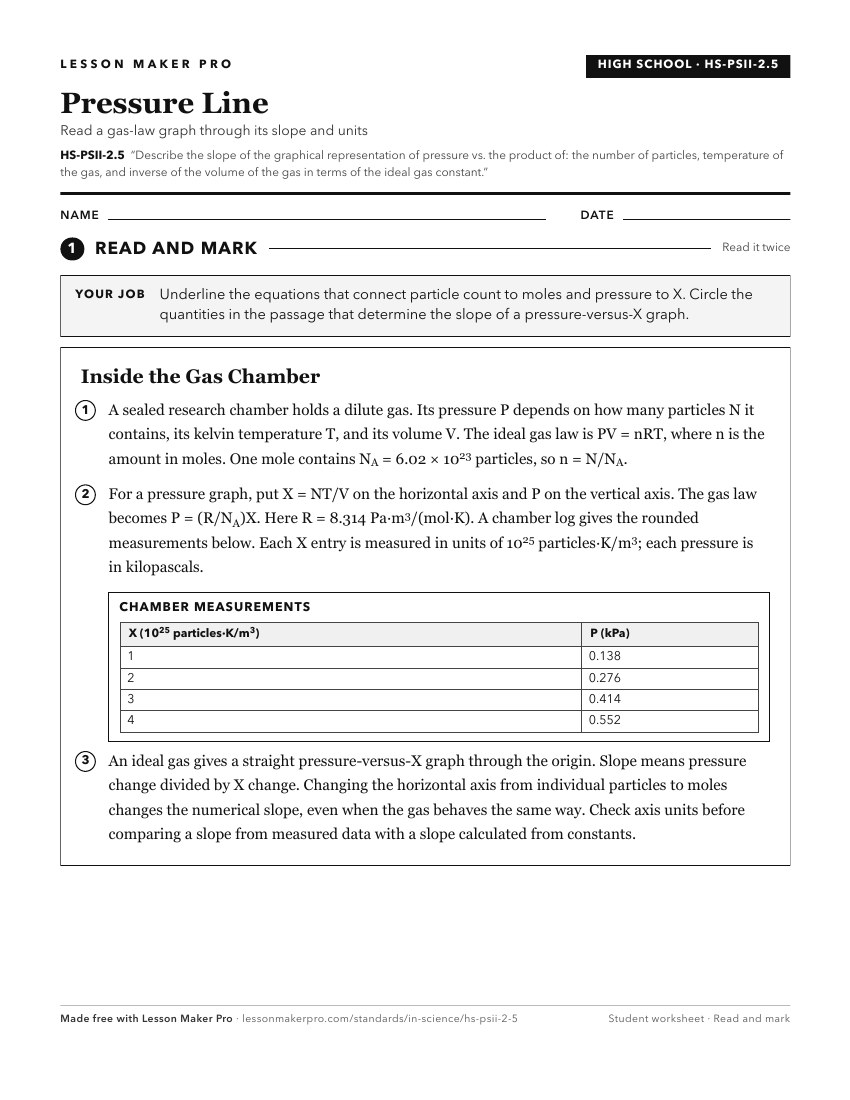
A ready-to-print activity worksheet aligned to HS-PSII-2.5, with an answer key for the teacher on its own page. No account needed.
PDF, US Letter, prints cleanly in black and white.
Download the worksheetKeep exploring
Related Standards
- HS-PSII-2.4
Develop graphical and mathematical representations that describe the relationship among the volume, temperature, and number of molecules of an ideal gas in a cl...
- HS-PSII-3.1
For a static, incompressible fluid, develop and apply graphical and mathematical representations that describe the relationship between the density and the pres...
- HS-PSII-5.3
Describe the slope of the graphical representation of current vs. voltage or voltage vs. current in terms of the resistance of the device.
- HS-PSII-2.6
Using PV graphs, qualitatively and quantitatively determine how changes in the pressure, volume, or temperature of an ideal gas allow the gas to do work and cla...
Turn this exact standard into a lesson
Grade, subject, topic, and the complete standard are prefilled. Create one free, no account needed.
Also for this standard:Make a WorksheetMake a QuizMake a Sub Lesson