Florida SS.7.G.5.1
The Standard
- SS.7.G.5
- Understand how human actions can impact the environment.
Use a choropleth or other map to geographically represent current information about issues of conservation or ecology in the local community.
Florida Next Generation Sunshine State Standards for Social Studies
Teacher's field guide
What This Standard Means
What Students Need to Do
- Students gather recent local data about an environmental concern and match the data to specific places. They create a clear thematic map with accurate shading or symbols, boundaries, a title, legend, date, and source.
What Mastery Looks Like
- A student can choose useful data ranges and map each area accurately. The finished map lets a reader compare places, spot patterns, and identify where action may be needed.
Common Misconceptions
- Students may color areas based on opinion, use raw totals when rates would be fairer, or choose data ranges that hide differences. They may also omit the legend, date, source, or geographic boundaries.
How to Assess It
- Give students a data table showing tree canopy percentages for five local areas and a blank map. Ask them to shade the map, add a legend, and write one pattern they notice.
Lesson moves
Ways to Teach It
Give pairs a neighborhood base map and recent litter counts, then have them choose intervals, shade areas, and build a legend.
Ask students to write which mapped area needs conservation action first, using two map details and one limit of the data.
Run a map error hunt where teams identify missing titles, uneven intervals, mismatched colors, outdated dates, and unsupported conclusions.
Use county recycling, flood, tree canopy, or water quality data to create a map for a city council briefing.
Free download
Printable SS.7.G.5.1 Worksheet
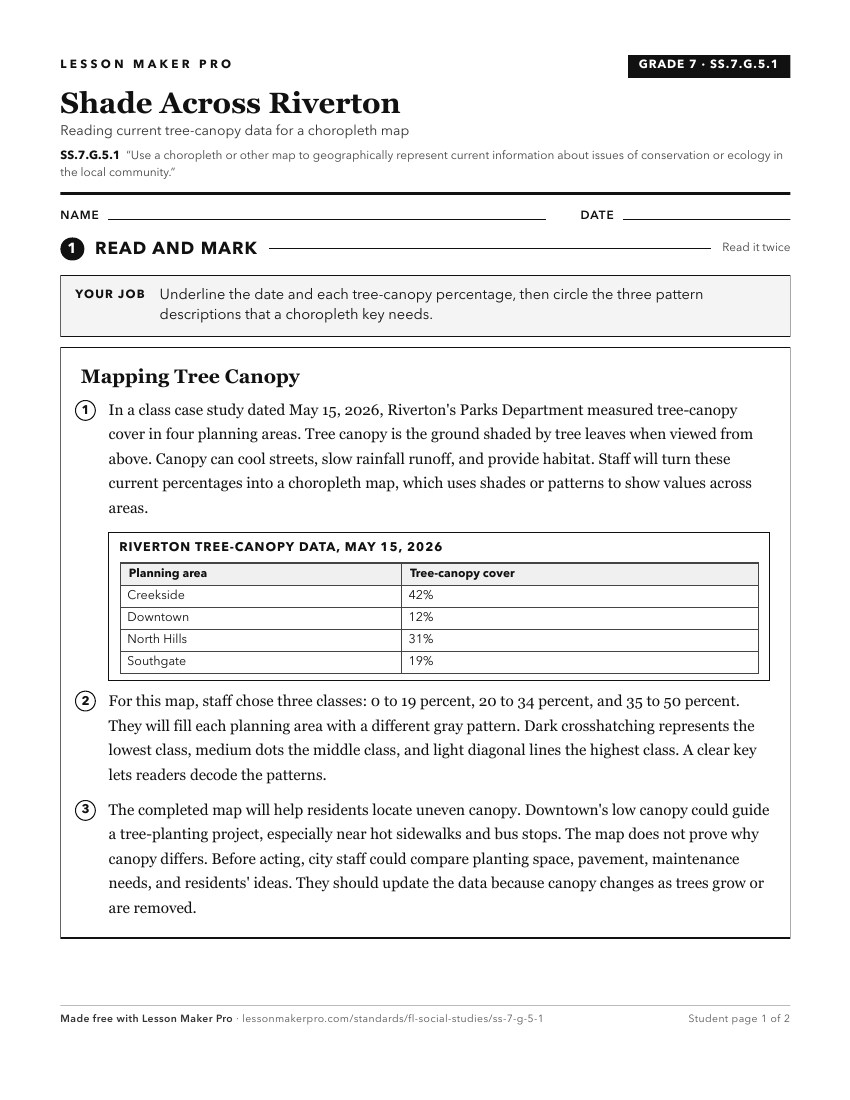
A ready-to-print activity worksheet aligned to SS.7.G.5.1, with an answer key for the teacher on its own page. No account needed.
PDF, US Letter, prints cleanly in black and white.
Download the worksheetKeep exploring
Related Standards
- SS.8.G.6.1
Use appropriate maps and other graphic representations to analyze geographic problems and changes over time throughout American history.
- SS.3.G.1.1
Use thematic maps, tables, charts, graphs, and photos to analyze geographic information.
- SS.7.G.6.1
Use Geographic Information Systems (GIS) or other technology to view maps of current information about the United States.
- SS.5.G.1.4
Construct maps, charts, and graphs to display geographic information.
Turn this exact standard into a lesson
Grade, subject, topic, and the complete standard are prefilled. Create one free, no account needed.
Also for this standard:Make a WorksheetMake a QuizMake a Sub Lesson