Florida SS.3.G.1.1
The Standard
- SS.3.G.1
- The World in Spatial Terms
Use thematic maps, tables, charts, graphs, and photos to analyze geographic information.
Florida Next Generation Sunshine State Standards for Social Studies
Teacher's field guide
What This Standard Means
What Students Need to Do
- Students read titles, keys, labels, symbols, and axes in maps and other visual sources. They compare information, spot patterns, and support a geographic conclusion with evidence.
What Mastery Looks Like
- Students accurately identify what each visual shows and locate specific data. They combine evidence from two sources to explain a pattern, such as where rainfall is highest.
Common Misconceptions
- Students may treat every map as a location map and ignore its theme or key. They may confuse graph axes, overlook units, or make claims based only on a photo.
How to Assess It
- Give students a rainfall map and bar graph for four Florida cities. Ask, “Which city receives the most rain, and what evidence supports your answer?”
Lesson moves
Ways to Teach It
Give groups a map, table, graph, and photos of Florida rainfall, then have them match sources showing the same pattern.
Display a population map and ask, “Where do people appear to cluster, and which map details support your answer?”
Play Evidence Match by having students pair geographic claims with supporting map symbols, table entries, graph bars, or photo details.
Use a local weather chart and storm map to decide which day and location are best for an outdoor class event.
Free download
Printable SS.3.G.1.1 Worksheet
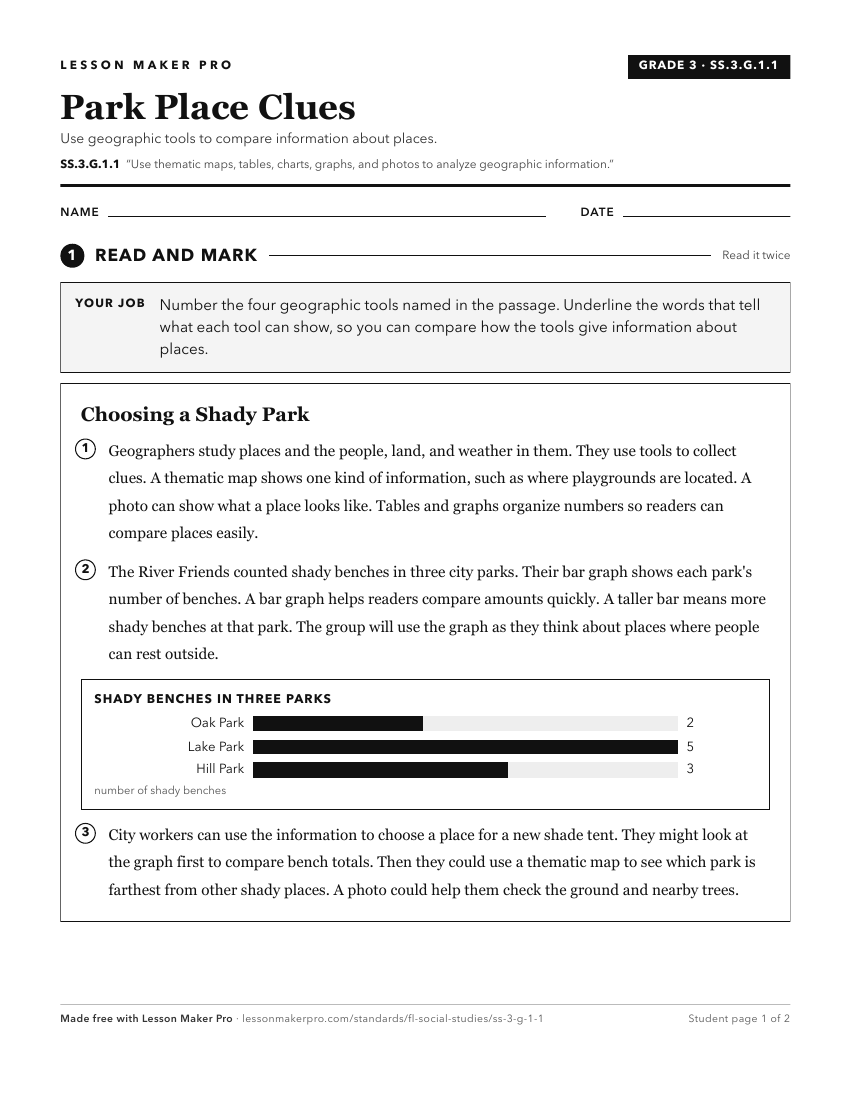
A ready-to-print activity worksheet aligned to SS.3.G.1.1, with an answer key for the teacher on its own page. No account needed.
PDF, US Letter, prints cleanly in black and white.
Download the worksheetKeep exploring
Related Standards
- SS.8.G.6.1
Use appropriate maps and other graphic representations to analyze geographic problems and changes over time throughout American history.
- SS.8.G.1
Understand how to use maps and other geographic representations, tools, and technology to report information.
- SS.7.G.1
Understand how to use maps and other geographic representations, tools, and technology to report information.
- SS.5.G.1.4
Construct maps, charts, and graphs to display geographic information.
Turn this exact standard into a lesson
Grade, subject, topic, and the complete standard are prefilled. Create one free, no account needed.
Also for this standard:Make a WorksheetMake a QuizMake a Sub Lesson