Florida SS.5.G.1.4
The Standard
- SS.5.G.1
- The World in Spatial Terms
Construct maps, charts, and graphs to display geographic information.
Florida Next Generation Sunshine State Standards for Social Studies
Teacher's field guide
What This Standard Means
What Students Need to Do
- Students turn location-based facts and numbers into a map, chart, or graph that fits the data. They add accurate titles, labels, symbols, keys, and number scales as needed.
What Mastery Looks Like
- Given data about population, rainfall, landforms, or resources, students create a clear and accurate display. A reader can understand the information without extra explanation.
Common Misconceptions
- Students may choose a map when a graph would show number comparisons more clearly. They may omit a key, use uneven number intervals, misplace locations, or leave axes unlabeled.
How to Assess It
- Give students these sample annual rainfall totals: Jacksonville 50 inches, Miami 62, Orlando 53, and Tampa 51. Ask them to create a labeled bar graph with equal intervals.
Lesson moves
Ways to Teach It
Give students a blank Florida map, county population cards, and colored pencils, then have them create color ranges and a matching key.
Show the same hurricane data on a map and bar graph, then ask, “What does each display make easier to notice?”
Have teams sort geographic data cards into map, chart, or graph piles, earning a point for each sound explanation.
Students read produce labels, plot countries of origin on a world map, and tally how many items came from each continent.
Free download
Printable SS.5.G.1.4 Worksheet
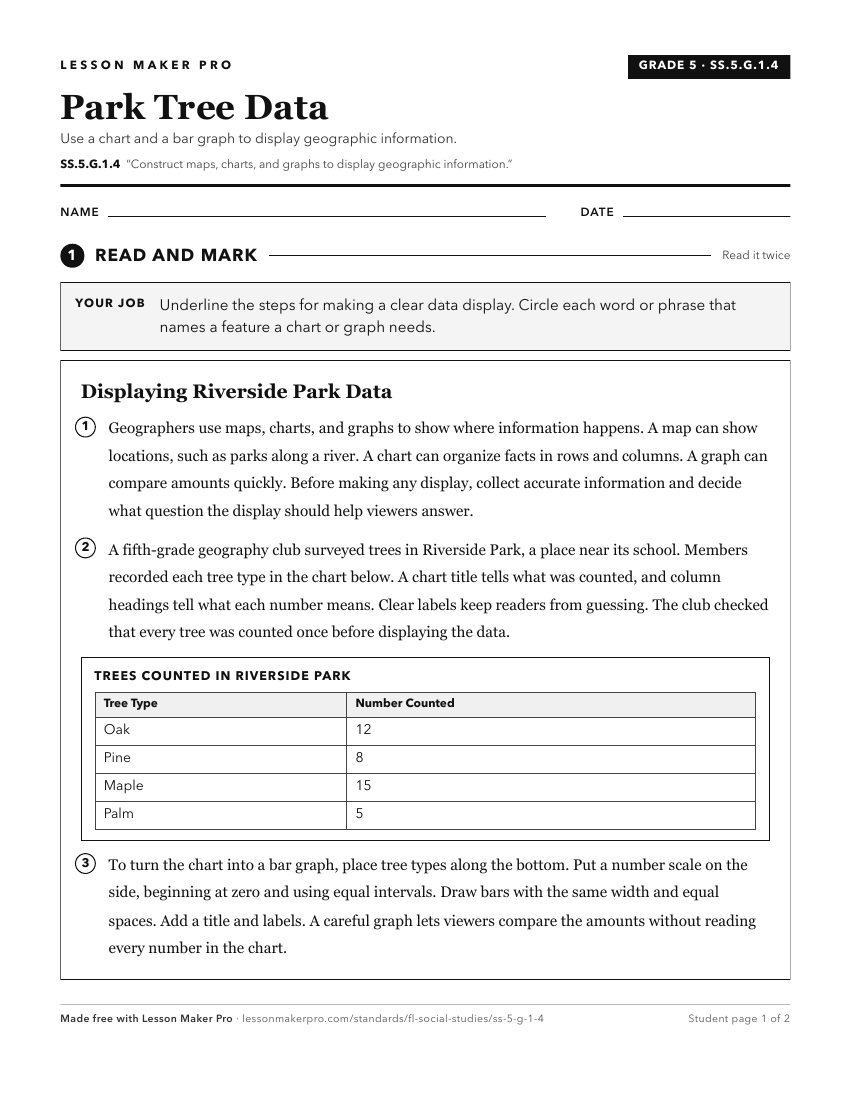
A ready-to-print activity worksheet aligned to SS.5.G.1.4, with an answer key for the teacher on its own page. No account needed.
PDF, US Letter, prints cleanly in black and white.
Download the worksheetKeep exploring
Related Standards
- SS.8.G.1
Understand how to use maps and other geographic representations, tools, and technology to report information.
- SS.3.G.1.1
Use thematic maps, tables, charts, graphs, and photos to analyze geographic information.
- SS.6.G.1
Understand how to use maps and other geographic representations, tools, and technology to report information.
- SS.7.G.1
Understand how to use maps and other geographic representations, tools, and technology to report information.
Turn this exact standard into a lesson
Grade, subject, topic, and the complete standard are prefilled. Create one free, no account needed.
Also for this standard:Make a WorksheetMake a QuizMake a Sub Lesson