Alabama Math MM.D3D.B.15
Standard Cluster
- MM.D3D.B
- Functions can be used to represent general trends in conditions that change over time and to predict future conditions based on present observations.
Use regression with statistical graphing technology to determine an equation that best fits a set of bivariate data, including nonlinear patterns. a. Create a scatter plot with a sufficient number of data points to predict a pattern. b. Describe the overall relationship between two quantitative variables (increase, decrease, linearity, concavity, extrema, inflection) or pattern of change. c. Make a prediction based upon patterns.
2019 Alabama Course of Study: Mathematics
Cluster contents
Standards in This Cluster
MM.D3D.B.15 is a cluster heading. These are the individual standards under it.
- MM.D3D.B.15.a
Create a scatter plot with a sufficient number of data points to predict a pattern.
- MM.D3D.B.15.b
Describe the overall relationship between two quantitative variables (increase, decrease, linearity, concavity, extrema, inflection) or pattern of change.
- MM.D3D.B.15.c
Make a prediction based upon patterns.
Teacher's field guide
What This Cluster Means
What Students Need to Do
- Plot enough paired measurements to see a pattern. Describe whether the points follow a line or curve, rise or fall, and show any peaks, valleys, or changes in bend. Use regression to fit an equation and predict a value.
What Mastery Looks Like
- A student plots the pairs correctly and chooses a regression model that follows the points. They report its equation, describe its shape in context, and make a sensible prediction near the observed values.
Common Misconceptions
- Students may connect the points in data-entry order instead of looking for an overall pattern. They may fit a line to a U-shaped pattern or confuse a peak with a change in bend. A fitted curve does not make predictions far beyond the data reliable.
How to Assess It
- Plot these (temperature °F, daily kWh) pairs in Desmos: (40,55), (45,48), (50,41), (55,36), (60,31), (65,29), (70,30), (75,33), (80,39), (85,47), (90,57), (95,69). Fit a quadratic regression, report its equation and minimum, and predict daily kWh at 72°F.
Lesson moves
Ways to Teach It
Plot 12 temperature and electricity pairs on graph paper, then enter them in Desmos and mark the fitted curve's lowest point.
Show a U-shaped electricity plot and ask, 'Why might a home use more power on both cold and hot days?'
In pairs, sort three 12-point scatter-plot cards as linear, U-shaped, or S-shaped, then test each choice with regression in Desmos.
Use a printed household electricity log to estimate power use at 75°F, then compare the estimate with the recorded value.
Free download
Printable MM.D3D.B.15 Worksheet
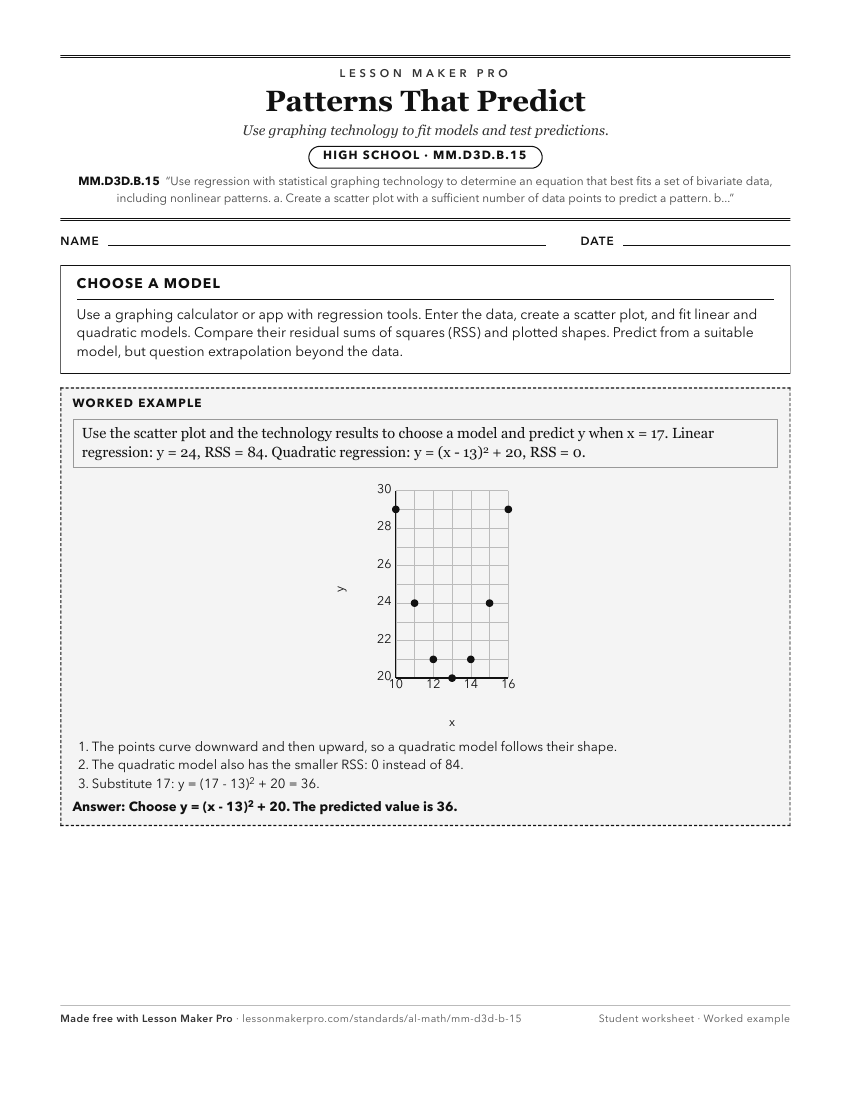
A ready-to-print activity worksheet aligned to MM.D3D.B.15, with an answer key for the teacher on its own page. No account needed.
PDF, US Letter, prints cleanly in black and white.
Download the worksheetKeep exploring
Related Standards
- GDA.DSP.D.12.b
Use technology to find the least-squares line of best fit for two quantitative variables.
- 8A.AF.A.8
Analyze the relationship (increasing or decreasing, linear or non-linear) between two quantities represented in a graph.
- 8.AF.E.17
Analyze the relationship (increasing or decreasing, linear or non-linear) between two quantities represented in a graph.
- GDA.DSP.A.7
Use mathematical and statistical reasoning with quantitative data, both univariate data (set of values) and bivariate data (set of pairs of values) that suggest...
Turn this cluster into a lesson
Grade, subject, topic, and the complete cluster are prefilled. Create one free, no account needed.
Also for this cluster:Make a WorksheetMake a QuizMake a Sub Lesson