Alabama Math MM.D3D.B.15.b
The Standard
- MM.D3D.B
- Functions can be used to represent general trends in conditions that change over time and to predict future conditions based on present observations.
- MM.D3D.B.15
- Use regression with statistical graphing technology to determine an equation that best fits a set of bivariate data, including nonlinear patterns.
Describe the overall relationship between two quantitative variables (increase, decrease, linearity, concavity, extrema, inflection) or pattern of change.
2019 Alabama Course of Study: Mathematics · Functions can be used to represent general trends in conditions that change over time and to predict future conditions based on present observations.
Teacher's field guide
What This Standard Means
What Students Need to Do
- Students read a graph or table showing how one quantity changes with another. They identify where it rises or falls and whether the change is steady or changing. They find peaks, valleys, and places where the curve changes its bend.
What Mastery Looks Like
- A student can describe a graph as rising but flattening, rather than just increasing. They can locate a maximum or minimum and point out where a curve switches from bending upward to bending downward.
Common Misconceptions
- Students may think a curve that bends downward must be falling. They may mistake a change in bend for a peak or valley. They may call any upward trend linear, even when the rise changes each step.
How to Assess It
- Exit ticket: Graph y = x³ − 3x from x = −2 to x = 2. Label where it rises, falls, turns, and changes its bend.
Lesson moves
Ways to Teach It
Plot daily pond levels of 2, 3, 5, 8, 10, 11, 10 cm on graph paper; mark the peak and changing steepness.
Ask: Can a graph rise while bending downward? Have students sketch an example and explain it in one sentence.
Give pairs six small graphs; one student describes rising, falling, and bending while the other picks the matching graph.
Plot monthly electricity use of 300, 360, 400, 420, 410 kWh; ask when growth slows and when use peaks.
Free download
Printable MM.D3D.B.15.b Worksheet
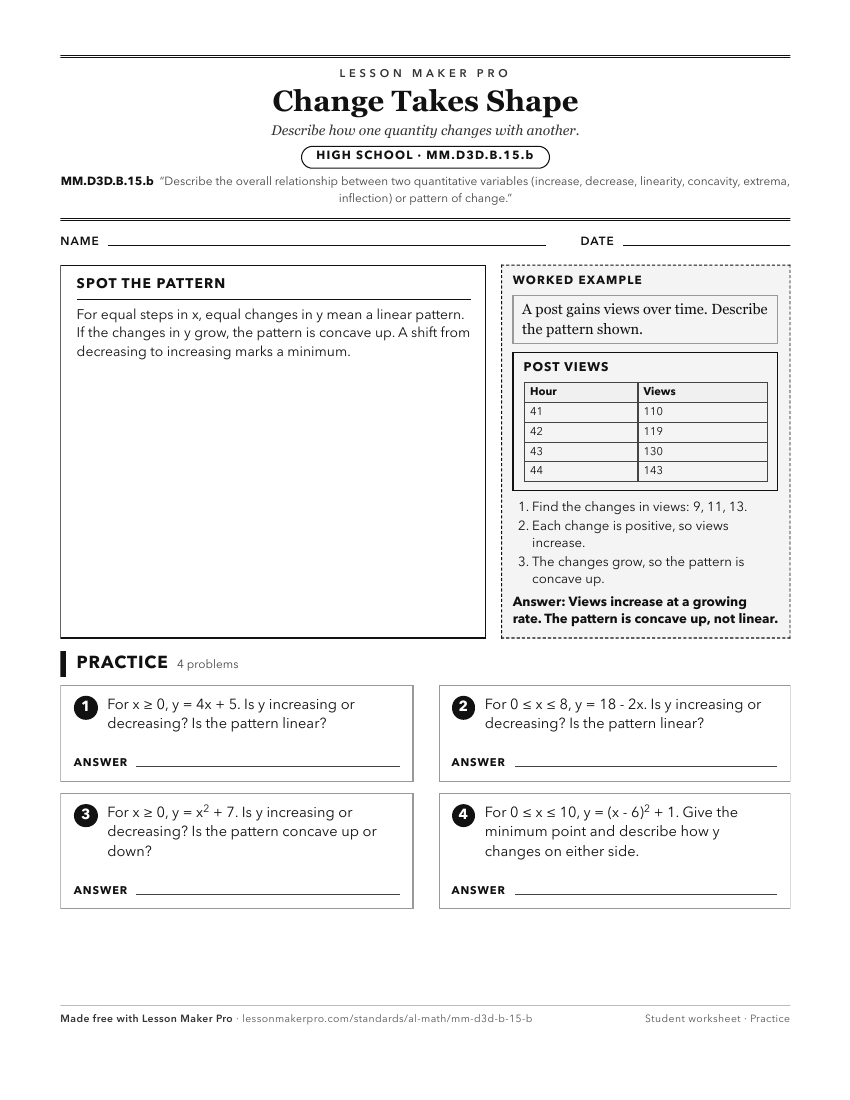
A ready-to-print activity worksheet aligned to MM.D3D.B.15.b, with an answer key for the teacher on its own page. No account needed.
PDF, US Letter, prints cleanly in black and white.
Download the worksheetKeep exploring
Related Standards
- 8.AF.E.17
Analyze the relationship (increasing or decreasing, linear or non-linear) between two quantities represented in a graph.
- 8A.AF.A.8
Analyze the relationship (increasing or decreasing, linear or non-linear) between two quantities represented in a graph.
- 8.AF.E.16.a
Interpret the rate of change (slope) and initial value of the linear function from a description of a relationship or from two points in a table or graph.
- 7A.AF.D.23.a
Interpret the rate of change (slope) and initial value of the linear function from a description of a relationship from two points in a table or graph.
Turn this exact standard into a lesson
Grade, subject, topic, and the complete standard are prefilled. Create one free, no account needed.
Also for this standard:Make a WorksheetMake a QuizMake a Sub Lesson