Alabama Math 8A.AF.A.8
The Standard
- 8A.AF.A
- Expressions can be rewritten in equivalent forms by using algebraic properties, including properties of addition, multiplication, and exponentiation, to make different characteristics or features visible.
Analyze the relationship (increasing or decreasing, linear or non-linear) between two quantities represented in a graph.
2019 Alabama Course of Study: Mathematics
Teacher's field guide
What This Standard Means
What Students Need to Do
- Students read a graph from left to right and tell where one quantity rises or falls as the other increases. They check whether equal steps on the horizontal axis produce equal changes on the vertical axis.
What Mastery Looks Like
- A student can point to parts of a graph that rise, fall, or stay level. They can identify a linear relationship by its constant rate of change and explain why a changing rate is nonlinear.
Common Misconceptions
- Students may judge increase by how high a point sits, rather than how the graph changes from left to right. They may call any rising graph linear, even when it curves.
How to Assess It
- Display a graph through (0,1), (1,2), (2,4), and (3,7). Ask: Does it increase or decrease? Is it linear? Use two equal horizontal steps as evidence.
Lesson moves
Ways to Teach It
Give pairs graph paper and points (0,0), (1,1), (2,4), (3,9); have them plot the points and compare rises across equal horizontal steps.
Display a rising curve and ask, 'Can a graph increase without being linear? Use two intervals to defend your answer.'
Run a card sort with eight graph cards; students label each increasing, decreasing, or mixed, then linear or nonlinear.
Pour equal cups of water into a straight-sided glass and a narrow-necked vase, then graph the water height after each cup.
Free download
Printable 8A.AF.A.8 Worksheet
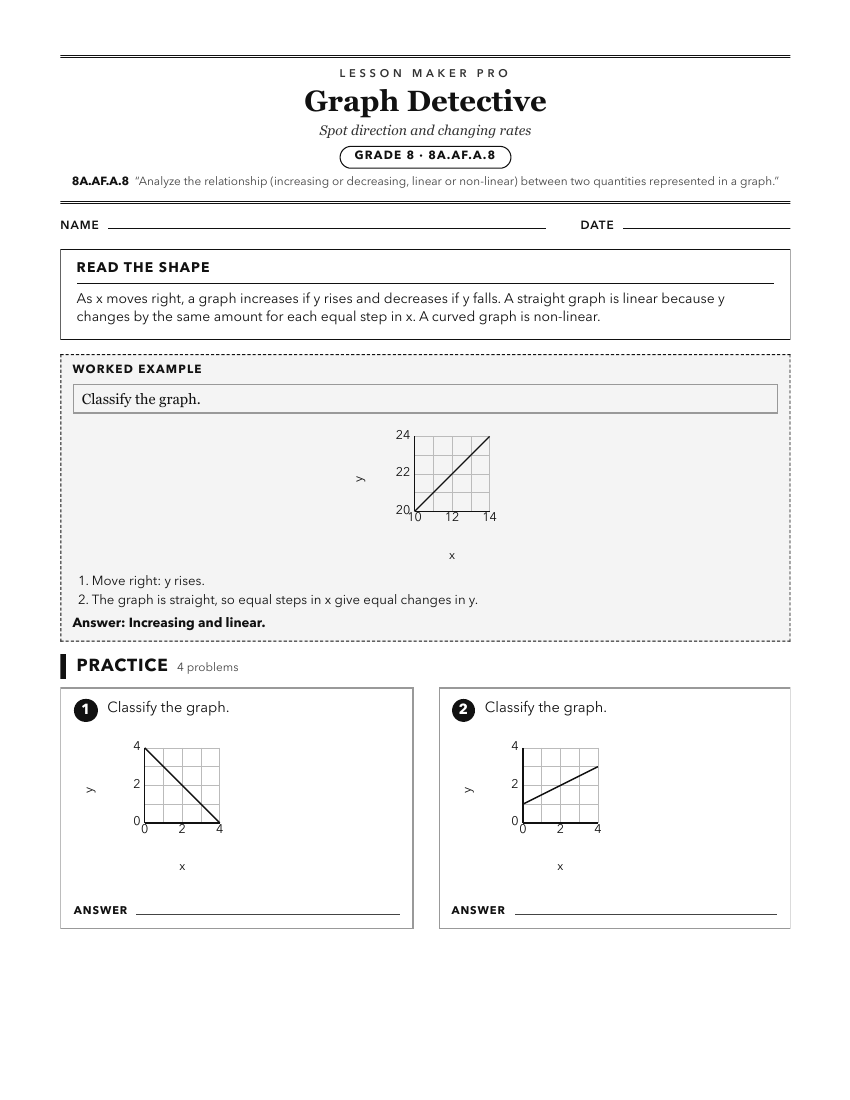
A ready-to-print activity worksheet aligned to 8A.AF.A.8, with an answer key for the teacher on its own page. No account needed.
PDF, US Letter, prints cleanly in black and white.
Download the worksheetKeep exploring
Related Standards
- 8.AF.E.17
Analyze the relationship (increasing or decreasing, linear or non-linear) between two quantities represented in a graph.
- A1P.AF.H.28
For a function that models a relationship between two quantities, interpret key features of graphs and tables in terms of the quantities, and sketch graphs show...
- 7A.PR.A.2
Represent a relationship between two quantities and determine whether the two quantities are related proportionally.
- 7.RP.A.2
Represent a relationship between two quantities and determine whether the two quantities are related proportionally.
Turn this exact standard into a lesson
Grade, subject, topic, and the complete standard are prefilled. Create one free, no account needed.
Also for this standard:Make a WorksheetMake a QuizMake a Sub Lesson