Alabama Math 7A.PR.A.2
Standard Cluster
- 7A.PR.A
- Analyze proportional relationships and use them to solve real-world problems and mathematical problems.
Represent a relationship between two quantities and determine whether the two quantities are related proportionally. a. Use equivalent ratios displayed in a table or in a graph of the relationship in the coordinate plane to determine whether a relationship between two quantities is proportional. b. Identify the constant of proportionality (unit rate) and express the proportional relationship using multiple representations including tables, graphs, equations, diagrams, and verbal descriptions of proportional relationships. c. Explain in context the meaning of a point (x,y) on the graph of a proportional relationship, with special attention to the points (0,0) and (1, r) where r is the unit rate.
2019 Alabama Course of Study: Mathematics
Cluster contents
Standards in This Cluster
7A.PR.A.2 is a cluster heading. These are the individual standards under it.
- 7A.PR.A.2.a
Use equivalent ratios displayed in a table or in a graph of the relationship in the coordinate plane to determine whether a relationship between two quantities ...
- 7A.PR.A.2.b
Identify the constant of proportionality (unit rate) and express the proportional relationship using multiple representations including tables, graphs, equation...
Teacher's field guide
What This Cluster Means
What Students Need to Do
- Students use tables and graphs to decide whether two quantities have a constant unit rate. They find that rate and show the relationship with an equation, a diagram, and words. They explain what points on the graph mean, including the origin and the point where x is 1.
What Mastery Looks Like
- For apples at $3 per pound, a student writes c = 3p and makes a matching table, graph, and diagram. They explain that (0,0) means no apples cost nothing, and (1,3) means one pound costs $3. They reject a price graph that starts at $2 because it is not proportional.
Common Misconceptions
- Students may think any straight line shows a proportional relationship, even if it does not pass through the origin. They may subtract values between rows instead of dividing to find the unit rate. They may mix up the axes and say (1,3) means one dollar buys three pounds.
How to Assess It
- Exit ticket: Two snack carts list (bags, dollars): Cart A (0,0), (1,3), (2,6); Cart B (0,2), (1,5), (2,8). Name the proportional cart, give its unit rate and equation, sketch its graph, and explain what (0,0) and (1,3) mean.
Lesson moves
Ways to Teach It
Use counters to build snack bags priced at $3 each, then record a table and plot points on grid paper.
Ask, "Why does (1,3) show the unit rate when x counts bags and y counts dollars?"
Run a card sort with four ratio tables; partners group proportional and nonproportional tables and write the unit rate beside each proportional one.
Compare taxi fares of $4 per mile and $4 plus $2 per mile; make tables to decide which cost is proportional.
Free download
Printable 7A.PR.A.2 Worksheet
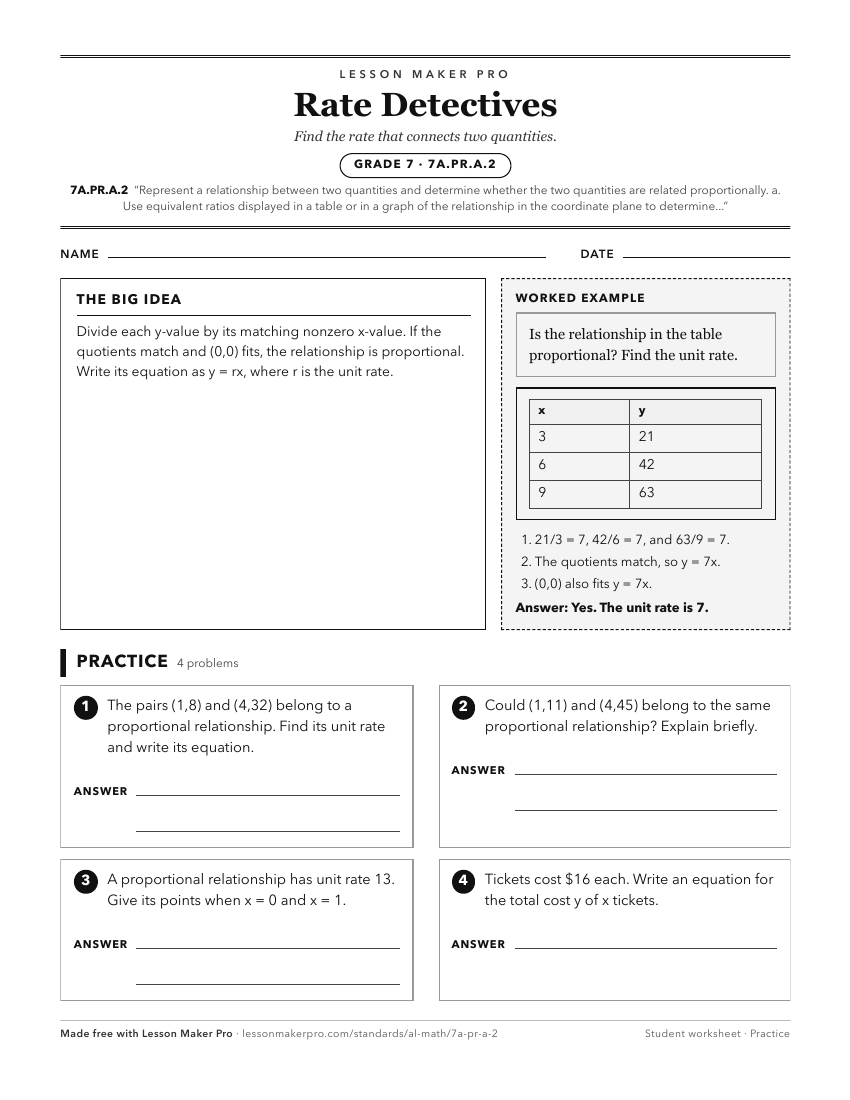
A ready-to-print activity worksheet aligned to 7A.PR.A.2, with an answer key for the teacher on its own page. No account needed.
PDF, US Letter, prints cleanly in black and white.
Download the worksheetKeep exploring
Related Standards
Turn this cluster into a lesson
Grade, subject, topic, and the complete cluster are prefilled. Create one free, no account needed.
Also for this cluster:Make a WorksheetMake a QuizMake a Sub Lesson