Alabama Math 7.RP.A.2
Standard Cluster
- 7.RP.A
- Analyze proportional relationships and use them to solve real-world and mathematical problems.
Represent a relationship between two quantities and determine whether the two quantities are related proportionally. a. Use equivalent ratios displayed in a table or in a graph of the relationship in the coordinate plane to determine whether a relationship between two quantities is proportional. b. Identify the constant of proportionality (unit rate) and express the proportional relationship using multiple representations including tables, graphs, equations, diagrams, and verbal descriptions. c. Explain in context the meaning of a point (x,y) on the graph of a proportional relationship, with special attention to the points (0,0) and (1, r) where r is the unit rate.
2019 Alabama Course of Study: Mathematics · Proportional Reasoning
Cluster contents
Standards in This Cluster
7.RP.A.2 is a cluster heading. These are the individual standards under it.
- 7.RP.A.2.a
Use equivalent ratios displayed in a table or in a graph of the relationship in the coordinate plane to determine whether a relationship between two quantities ...
- 7.RP.A.2.b
Identify the constant of proportionality (unit rate) and express the proportional relationship using multiple representations including tables, graphs, equation...
Teacher's field guide
What This Cluster Means
What Students Need to Do
- Students use tables and graphs to check whether two quantities have a constant ratio. They find the unit rate and show the relationship with a table, graph, equation, diagram, and words. They explain what points on the graph mean in the situation.
What Mastery Looks Like
- For markers at $2 each, a student makes a matching table, graph, equation, and sketch. They explain that (0,0) means no markers cost nothing and (1,2) means one marker costs $2. They reject a price plan with a $3 starting fee as nonproportional.
Common Misconceptions
- Students may call any straight line proportional, even if it misses the origin. They may mistake equal increases for equal ratios or flip dollars per item into items per dollar. They may read (1,2) as two items costing $1.
How to Assess It
- Give students these prices: 2 notebooks cost $6 and 5 notebooks cost $15. Ask them to write an equation, plot the points, and explain what (1,3) means.
Lesson moves
Ways to Teach It
Give pairs 12 counters and a $2 price tag per counter; have them build a price table and graph for 0 to 6 counters.
Ask, 'A taxi charges $4 to start and $2 per mile. Is the fare proportional to miles? What happens at zero miles?'
Sort cards showing y=3x, y=3x+2, and their graphs; label each proportional or not and name any unit rate.
Post a menu price of 2 muffins for $5; have students predict the cost of 6 muffins and explain the point (1, 2.50).
Free download
Printable 7.RP.A.2 Worksheet
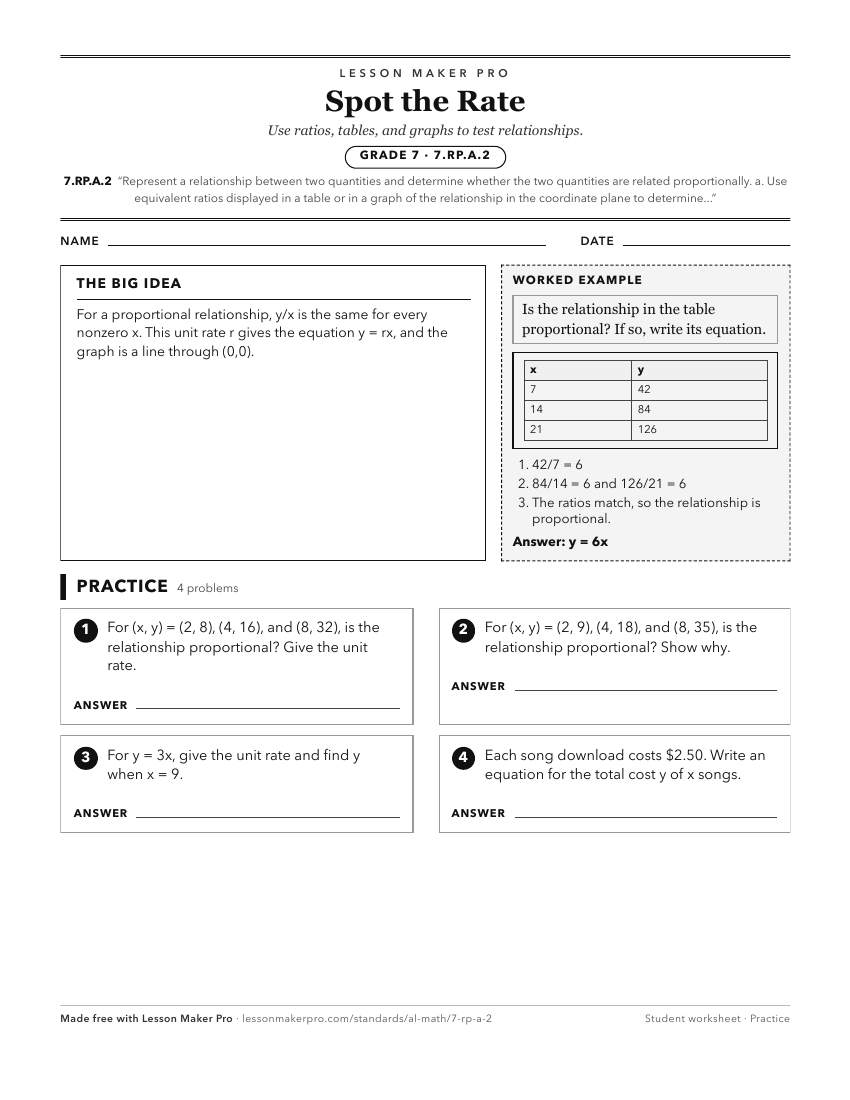
A ready-to-print activity worksheet aligned to 7.RP.A.2, with an answer key for the teacher on its own page. No account needed.
PDF, US Letter, prints cleanly in black and white.
Download the worksheetKeep exploring
Related Standards
- 7A.PR.A.2
Represent a relationship between two quantities and determine whether the two quantities are related proportionally.
- 8.AF.B.7
Determine whether a relationship between two variables is proportional or non-proportional.
- 7A.PR.A.2.a
Use equivalent ratios displayed in a table or in a graph of the relationship in the coordinate plane to determine whether a relationship between two quantities ...
Turn this cluster into a lesson
Grade, subject, topic, and the complete cluster are prefilled. Create one free, no account needed.
Also for this cluster:Make a WorksheetMake a QuizMake a Sub Lesson