Alabama Math GDA.DSP.A.7
The Standard
- GDA.DSP.A
- Mathematical and statistical reasoning about data can be used to evaluate conclusions and assess risks.
Use mathematical and statistical reasoning with quantitative data, both univariate data (set of values) and bivariate data (set of pairs of values) that suggest a linear association, in order to draw conclusions and assess risk.
2019 Alabama Course of Study: Mathematics
Teacher's field guide
What This Standard Means
What Students Need to Do
- Students summarize a set of values using its center and spread. They plot paired values, describe a roughly linear trend, and use the data to make a prediction or judge risk.
What Mastery Looks Like
- Students compare commute times and explain which route is more likely to miss a deadline. They use a trend line to estimate a value within the data range and explain how an outlier could weaken the estimate.
Common Misconceptions
- Students may compare averages but ignore wide spread or outliers. They may treat a trend as proof of cause, predict far beyond the plotted values, or compare event counts without checking group sizes.
How to Assess It
- Exit ticket: Reaction times in milliseconds at 8, 12, 16, and 20 hours awake are 220, 250, 290, and 340. At 18 hours, does the trend suggest a reaction time above 300 milliseconds? Estimate and explain.
Lesson moves
Ways to Teach It
Plot commute times 12,15,16,17,30 and 16,17,18,19,20 on two number lines; choose the safer route for a 21-minute deadline.
Ask: Hotter days bring more ice cream sales and more heat illness. Does ice cream cause illness? What else explains the pattern?
Partners plot car age and price pairs (1,18), (2,16), (3,14), (4,13), (5,11), then estimate price at age 3.5.
Compare 6 crashes in 30,000 trips with 9 crashes in 90,000 trips; calculate crashes per 10,000 trips before choosing a route.
Free download
Printable GDA.DSP.A.7 Worksheet
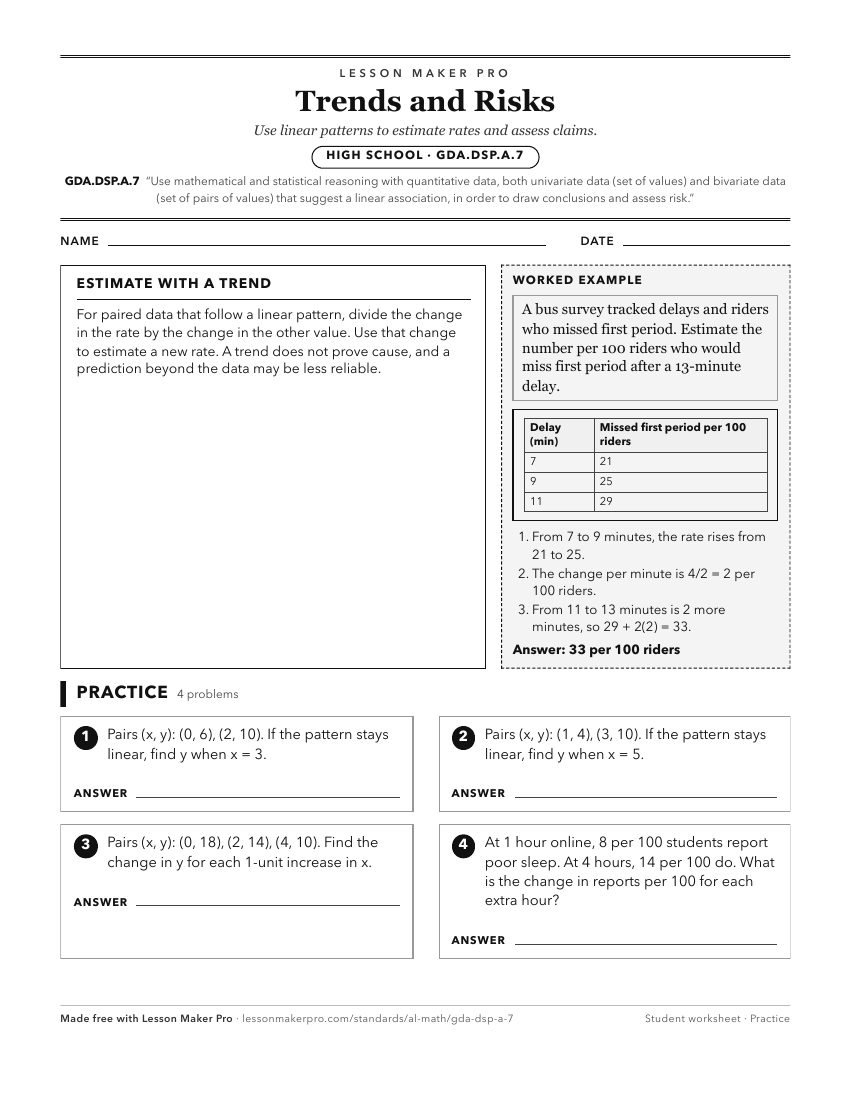
A ready-to-print activity worksheet aligned to GDA.DSP.A.7, with an answer key for the teacher on its own page. No account needed.
PDF, US Letter, prints cleanly in black and white.
Download the worksheetKeep exploring
Related Standards
- 8A.DSP.E.41
Use mathematical and statistical reasoning with bivariate categorical data in order to draw conclusions and assess risk.
- A2S.DSP.A
Mathematical and statistical reasoning about data can be used to evaluate conclusions and assess risks.
- 8A.DSP.E
Mathematical and statistical reasoning about data can be used to evaluate conclusions and assess risks.
- A1P.DSP.A
Mathematical and statistical reasoning about data can be used to evaluate conclusions and assess risks.
Turn this exact standard into a lesson
Grade, subject, topic, and the complete standard are prefilled. Create one free, no account needed.
Also for this standard:Make a WorksheetMake a QuizMake a Sub Lesson