Alabama Math A2S.DSP.A
Standard Cluster
Mathematical and statistical reasoning about data can be used to evaluate conclusions and assess risks.
2019 Alabama Course of Study: Mathematics · Algebra II With Statistics
Cluster contents
Standards in This Cluster
A2S.DSP.A is a cluster heading. These are the individual standards under it.
Teacher's field guide
What This Cluster Means
What Students Need to Do
- Students calculate rates from data and compare risks across groups. They decide whether the numbers support a claim and check how the data was collected.
What Mastery Looks Like
- Given 12 injuries among 200 helmet users and 20 among 200 nonusers, a student finds rates of 6% and 10%. They explain that the difference does not, by itself, prove helmets caused the lower rate.
Common Misconceptions
- Students compare injury counts without checking group sizes. They may call a difference of 4 percentage points a 4% difference, or assume a lower rate proves what caused it.
How to Assess It
- Exit ticket: A school reports 12 injuries among 200 helmet users and 20 among 200 nonusers. Find both injury rates and explain whether these numbers prove helmets prevent injuries.
Lesson moves
Ways to Teach It
Give pairs two bags of 50 tiles, with three red tiles in one and five in the other; have them count and compare rates.
Ask students to write whether lower injury rates among helmet users prove helmets work, and what else they would need to know.
Use claim cards showing 8/100 versus 12/100 and 8/100 versus 12/200; teams calculate rates and name the higher-risk group.
Show medicine labels reporting side effects in 2/100 and 10/1,000 users; ask students which label shows the higher reported risk.
Free download
Printable A2S.DSP.A Worksheet
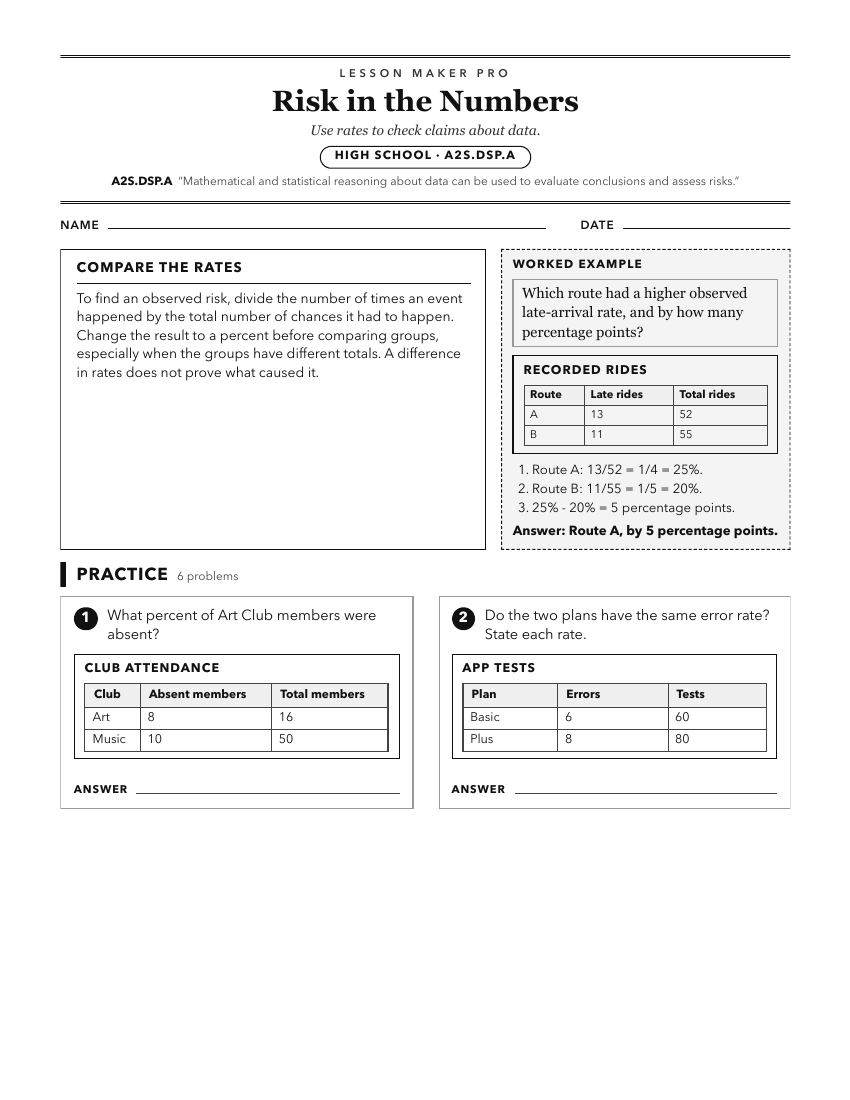
A ready-to-print activity worksheet aligned to A2S.DSP.A, with an answer key for the teacher on its own page. No account needed.
PDF, US Letter, prints cleanly in black and white.
Download the worksheetKeep exploring
Related Standards
- 8A.DSP.E
Mathematical and statistical reasoning about data can be used to evaluate conclusions and assess risks.
- A1P.DSP.A
Mathematical and statistical reasoning about data can be used to evaluate conclusions and assess risks.
- GDA.DSP.A
Mathematical and statistical reasoning about data can be used to evaluate conclusions and assess risks.
- GDA.DSP.A.7
Use mathematical and statistical reasoning with quantitative data, both univariate data (set of values) and bivariate data (set of pairs of values) that suggest...
Turn this cluster into a lesson
Grade, subject, topic, and the complete cluster are prefilled. Create one free, no account needed.
Also for this cluster:Make a WorksheetMake a QuizMake a Sub Lesson