Alabama Math 8A.DSP.E
Standard Cluster
Mathematical and statistical reasoning about data can be used to evaluate conclusions and assess risks.
2019 Alabama Course of Study: Mathematics · Grade 8 Accelerated Standards
Cluster contents
Standards in This Cluster
8A.DSP.E is a cluster heading. These are the individual standards under it.
Teacher's field guide
What This Cluster Means
What Students Need to Do
- Students use data to decide whether a claim is supported. They compare the size of a risk, look at how many people were counted, and explain what the data cannot show.
What Mastery Looks Like
- A student can explain that a risk rising from 2 in 100 to 4 in 100 has doubled, but has increased by only 2 people per 100. They check the sample before accepting a headline about that change.
Common Misconceptions
- Students may hear “risk doubles” and assume the risk is now high. They may treat a survey of 10 people as strong evidence or assume a pattern in the data proves its cause.
How to Assess It
- Give students this exit ticket: An ad says a problem doubles from 2 in 100 people to 4 in 100 people. How many more people per 100 are affected, and does the ad tell the whole story?
Lesson moves
Ways to Teach It
Put 2 red and 18 white counters in one bag, 6 red and 14 white in another; draw 10 times from each to compare risks.
Show “Risk doubles” beside “Risk rises from 2 in 100 to 4 in 100”; ask students which headline gives a clearer picture and why.
Give pairs cards showing 1 of 5 and 20 of 100 people affected; have them choose which claim needs more data.
Compare rain forecasts of 20% and 70% for two days; have students pick a field day and explain their choice.
Free download
Printable 8A.DSP.E Worksheet
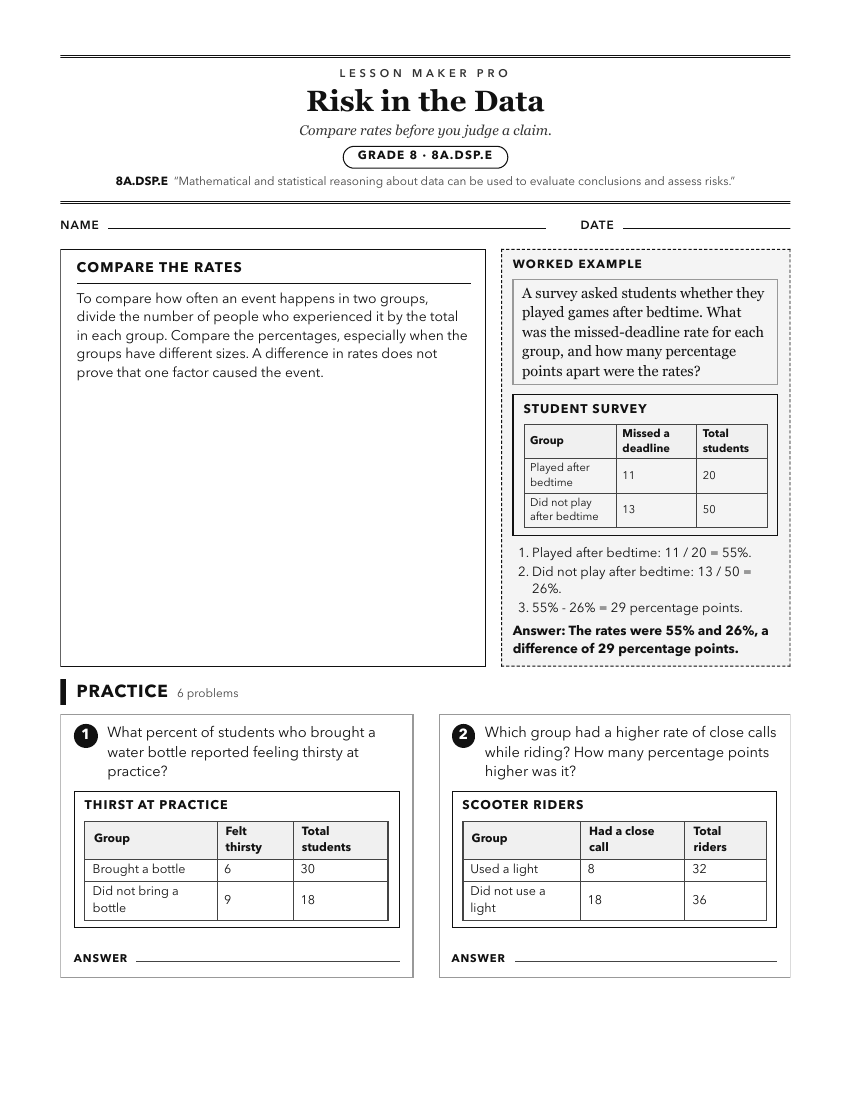
A ready-to-print activity worksheet aligned to 8A.DSP.E, with an answer key for the teacher on its own page. No account needed.
PDF, US Letter, prints cleanly in black and white.
Download the worksheetKeep exploring
Related Standards
- A2S.DSP.A
Mathematical and statistical reasoning about data can be used to evaluate conclusions and assess risks.
- GDA.DSP.A
Mathematical and statistical reasoning about data can be used to evaluate conclusions and assess risks.
- A1P.DSP.A
Mathematical and statistical reasoning about data can be used to evaluate conclusions and assess risks.
- GDA.DSP.A.7
Use mathematical and statistical reasoning with quantitative data, both univariate data (set of values) and bivariate data (set of pairs of values) that suggest...
Turn this cluster into a lesson
Grade, subject, topic, and the complete cluster are prefilled. Create one free, no account needed.
Also for this cluster:Make a WorksheetMake a QuizMake a Sub Lesson